See All Use Cases

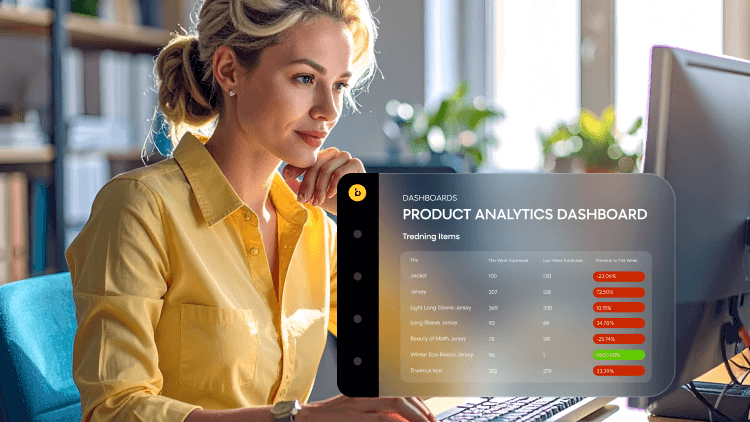
Product Analytics Dashboard

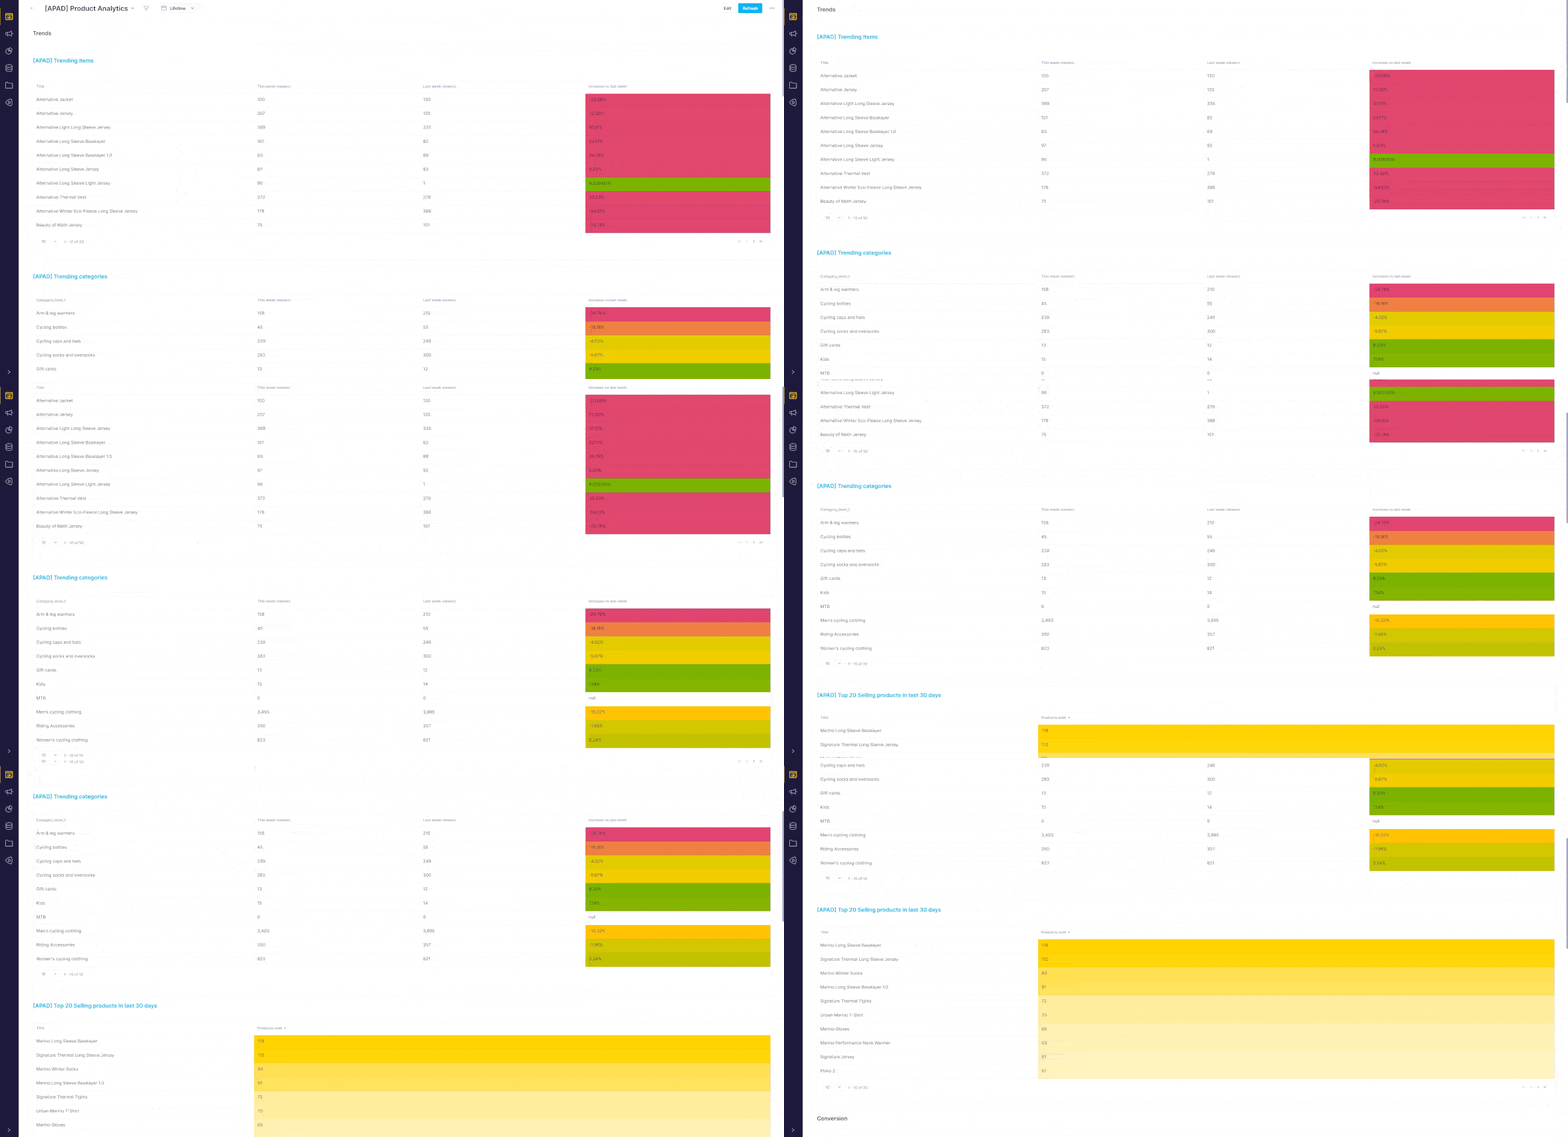
The Product Analytics Dashboard’ is a comprehensive tool that provides insights into various trends on your website, including the most viewed products and categories. Get an exclusive list of the top 20 selling items in the last month, and understand more about your site’s conversion rates, such as the best conversion products and categories over a certain period.

Goal

Maturity

Channel

Tags

Metrics

Industries

bloomreach_pattern
use case example

Ecommerce businesses often need help to make informed decisions due to a lack of access to real-time, data-driven insights. Our Product Analytics Dashboard directly tackles this challenge, providing vital information on product views, selling trends, and conversion rates. This information enables businesses to optimize their offerings, identify best-selling products, and understand users’ behavior.

Achieve significant benchmarks. By identifying and understanding sales trends and the best-performing products, you can design effective strategies to boost their conversion rates. Additionally, you can improve customer retention by understanding and responding to user behavior trends.

Explore more from our Use Case Library

Web Personalization
Interactive Subscriber Banner
SMS
SMS Subscription DOI Checkout Banner
Analytics
Email Optimization Autosegments
Web Personalization
On-Exit Banner With Last-Viewed Items
Email
Half-Birthday Campaign
Email
Abandoned Search Email Flow

Personalized Customer Journeys Lead To Better Customer Experiences

There’s a reason we’re trusted by 1,400+ brands worldwide

Life With Bloomreach

Watch this video to learn what your life could look like when you use Bloomreach.