One of the first major peaks that most retailers see in the middle to back half of the year is around back-to-school (B2S) time. As backpacks, clothing, school supplies, and dorm room essentials go flying off the shelves, you may notice a shift in consumer expectations and behavior as they vote with their dollars in terms of preference, assortment, and easiest-to-use experience.
We analyzed data for the last few years and pulled out some insights to help you optimize for back to school and beyond. Here are some of the most popular trends that emerged from our Bloomreach Commerce Pulse data:
Pop Culture Is in High Demand
No, this isn’t (entirely) due to the reemergence of Barbie as a pop culture icon. Our data reveals that pop culture is always in high demand around this time of year, especially products based on popular movies, shows, and characters. A few optimization strategies that merchandisers should be watching for:
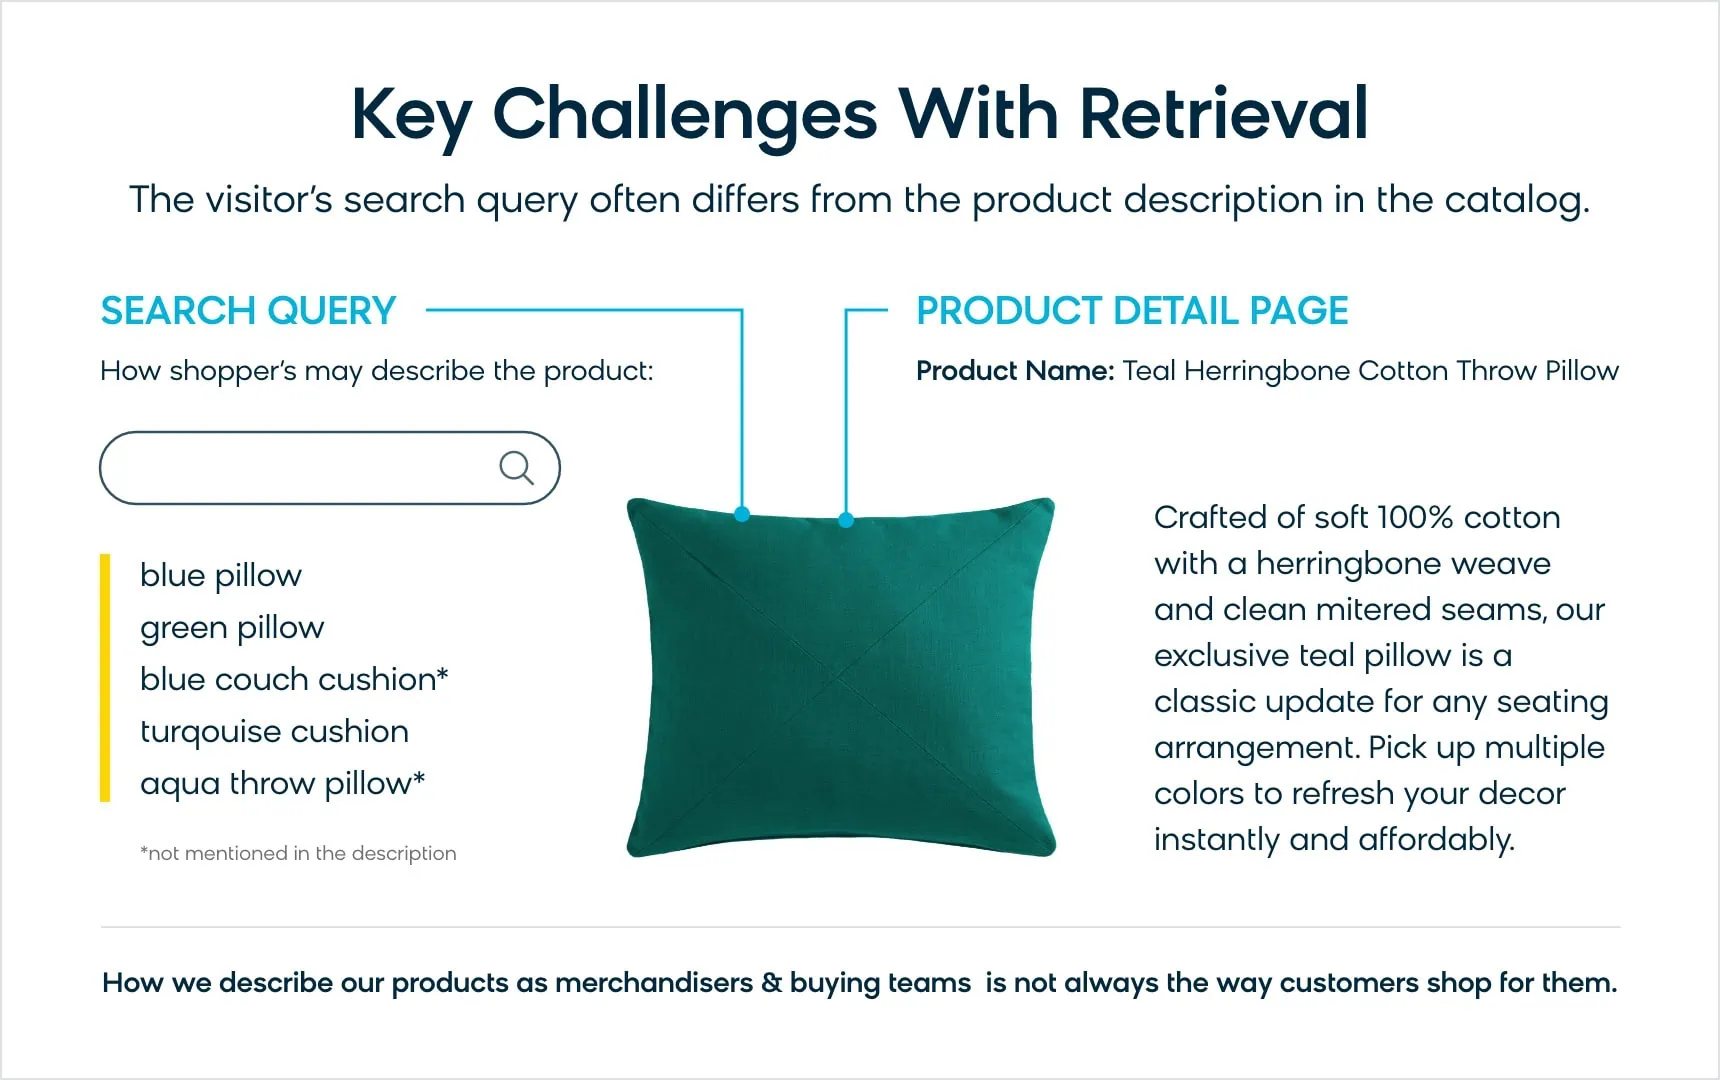
- Product Detail Naming vs. How Consumers Search — If consumers search for “graphic tee” and you don’t include “graphic” in your description or copy, it’s going to make it very difficult for consumers to see the full breadth of your assortment
- Cross-Sell and Upsell Opportunities — On key landing pages, look for opportunities to include both seasonally relevant products plus evergreen styles and accessories to drive an increase in AOV and basket size
Clothing Ranks Highly in Top Searches
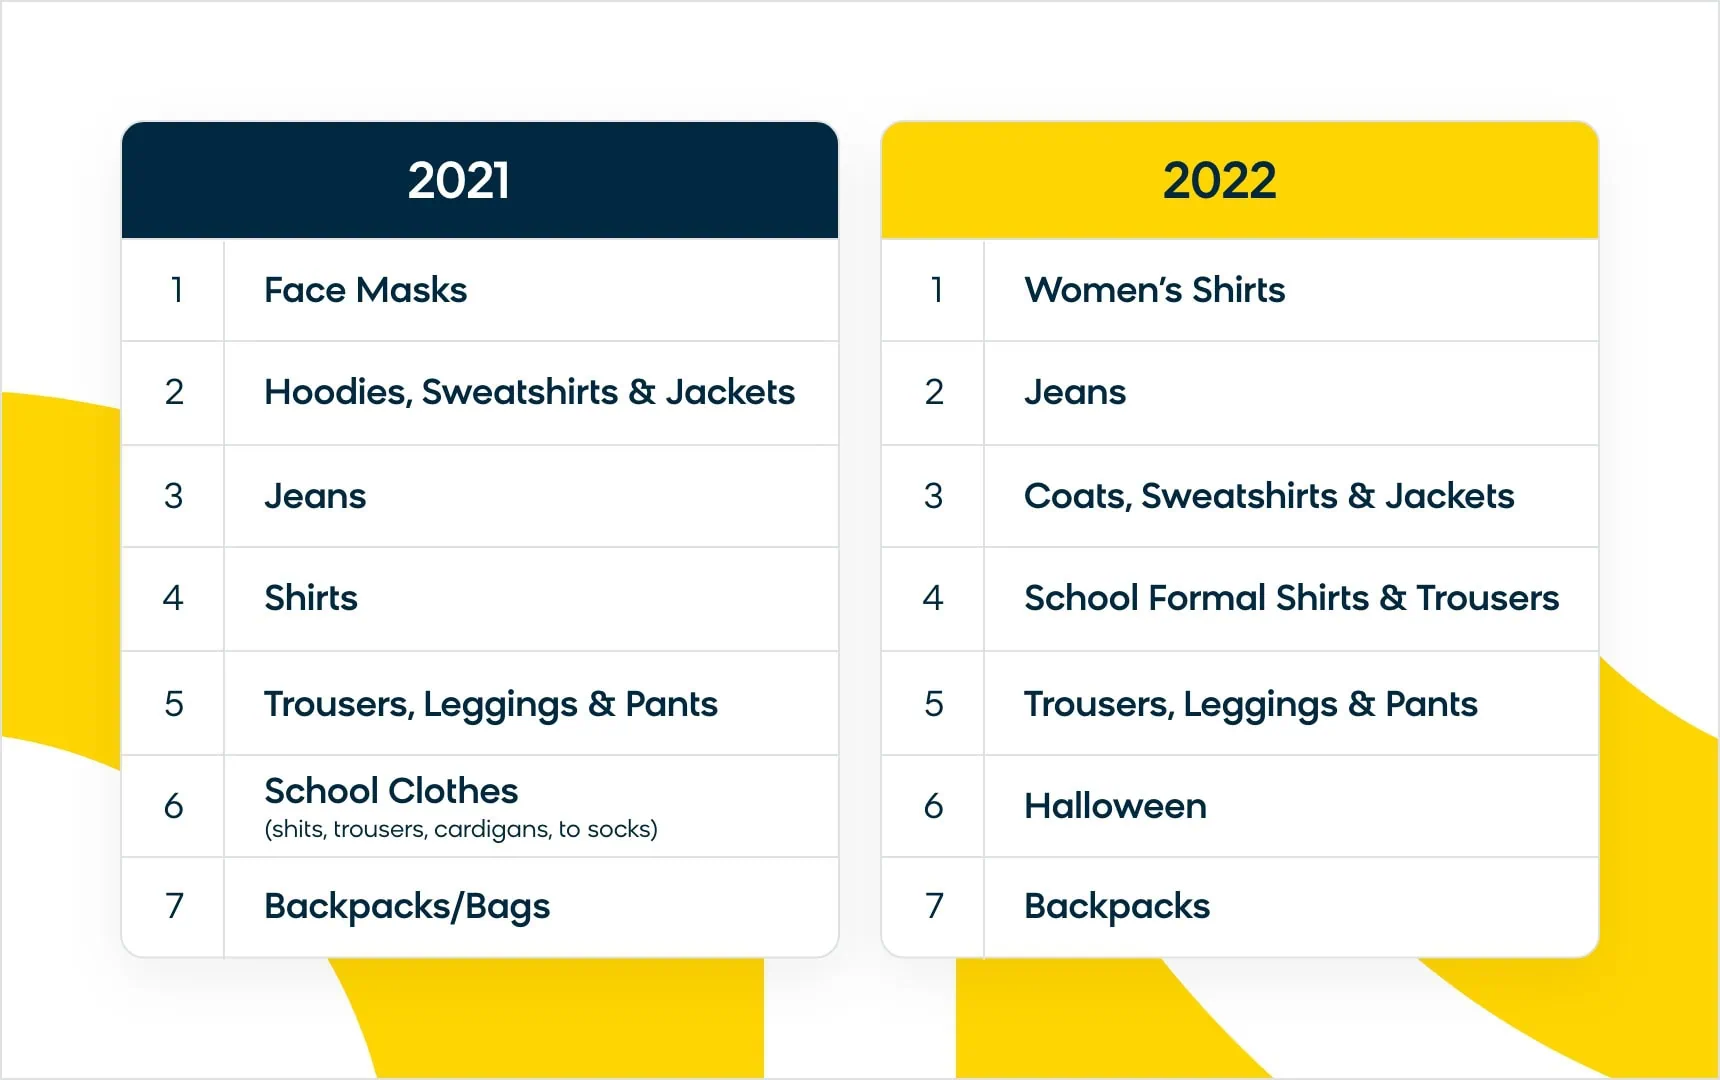
This makes sense as a new school year equals new threads and gear. Customers are searching for jeans, dresses, joggers, jeggings, girls’ clothing, girls dresses, girls shirts, boys pants, boys joggers, and more. As digital merchandisers, it’s important that we create experiences that allow our consumers to find the most relevant products as quickly as possible.
A customer searching for “girls’ clothing” is most likely looking for clothing suitable for young girls. If we surface women’s clothing when they search, they’ll probably bounce and go look somewhere else. Our Bloomreach Commerce Pulse data shows that across our merchants, there’s a 33% lift in search revenue contribution for the 2022 back-to-school timeframe vs. in 2021. This means that consumers are buying more when they see relevant results.
Top Searches from 2021 vs. 2022
A Full Funnel Approach Is a Must
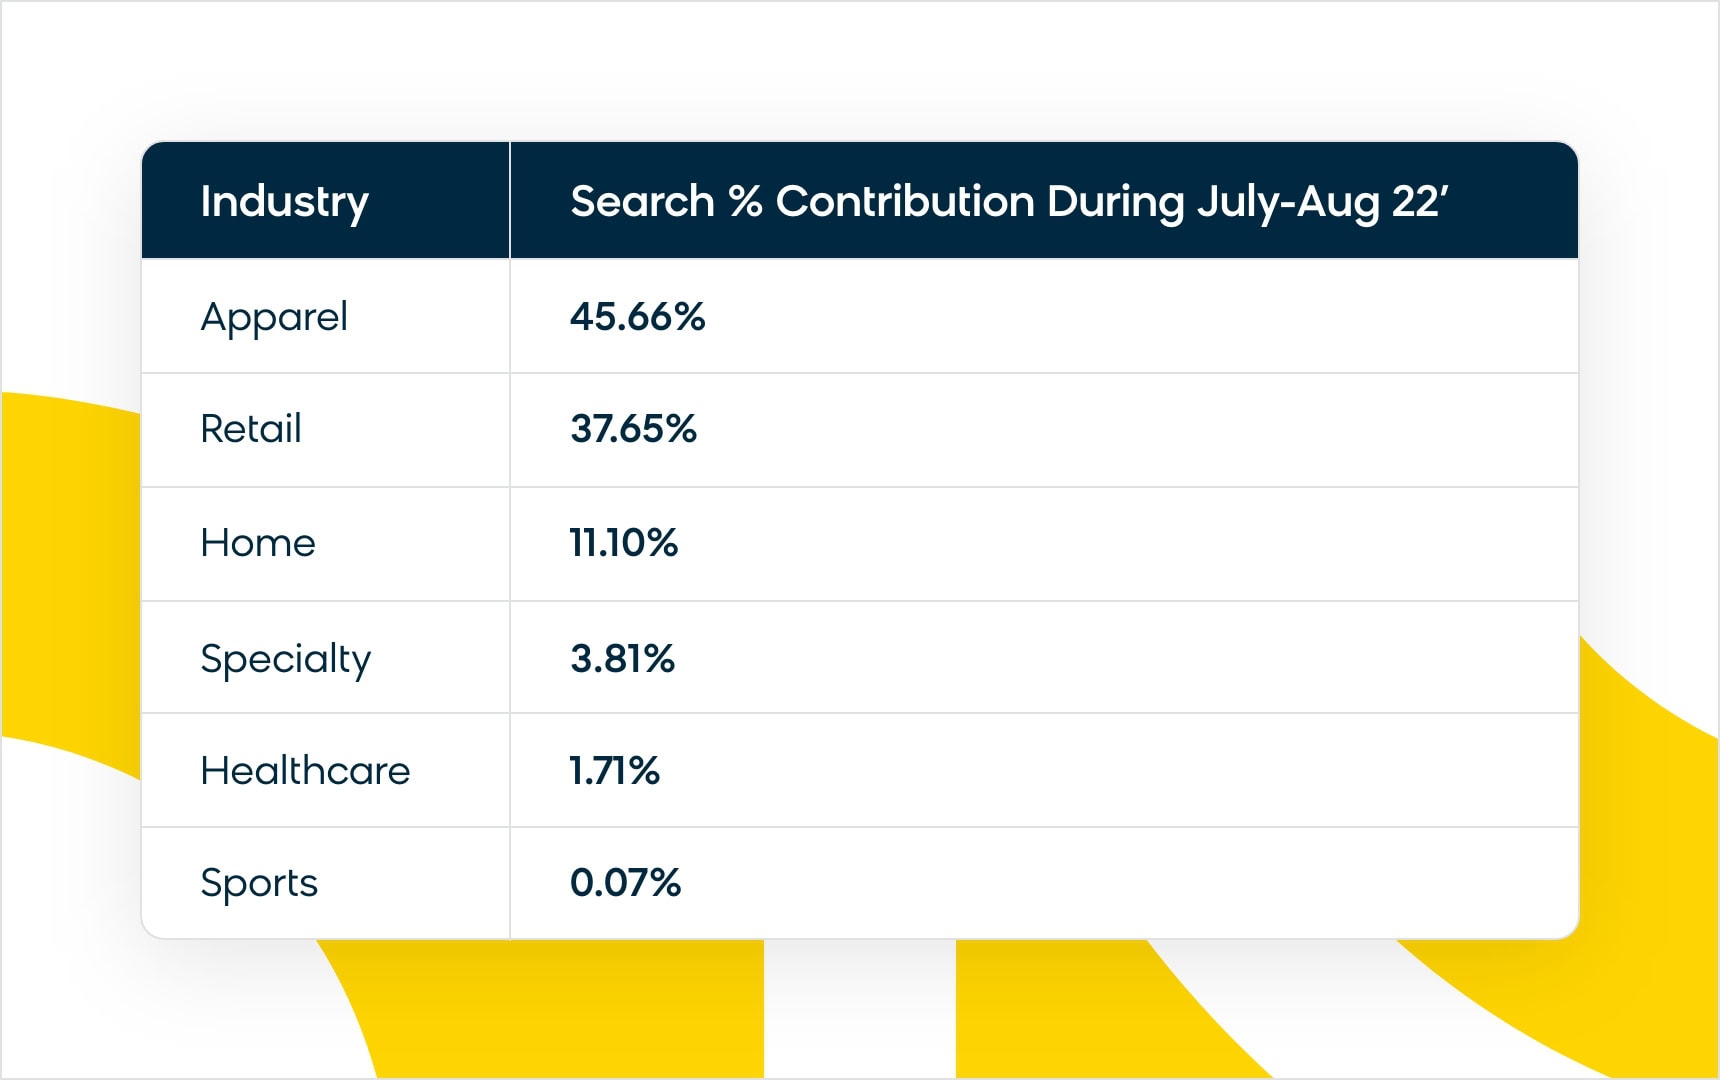
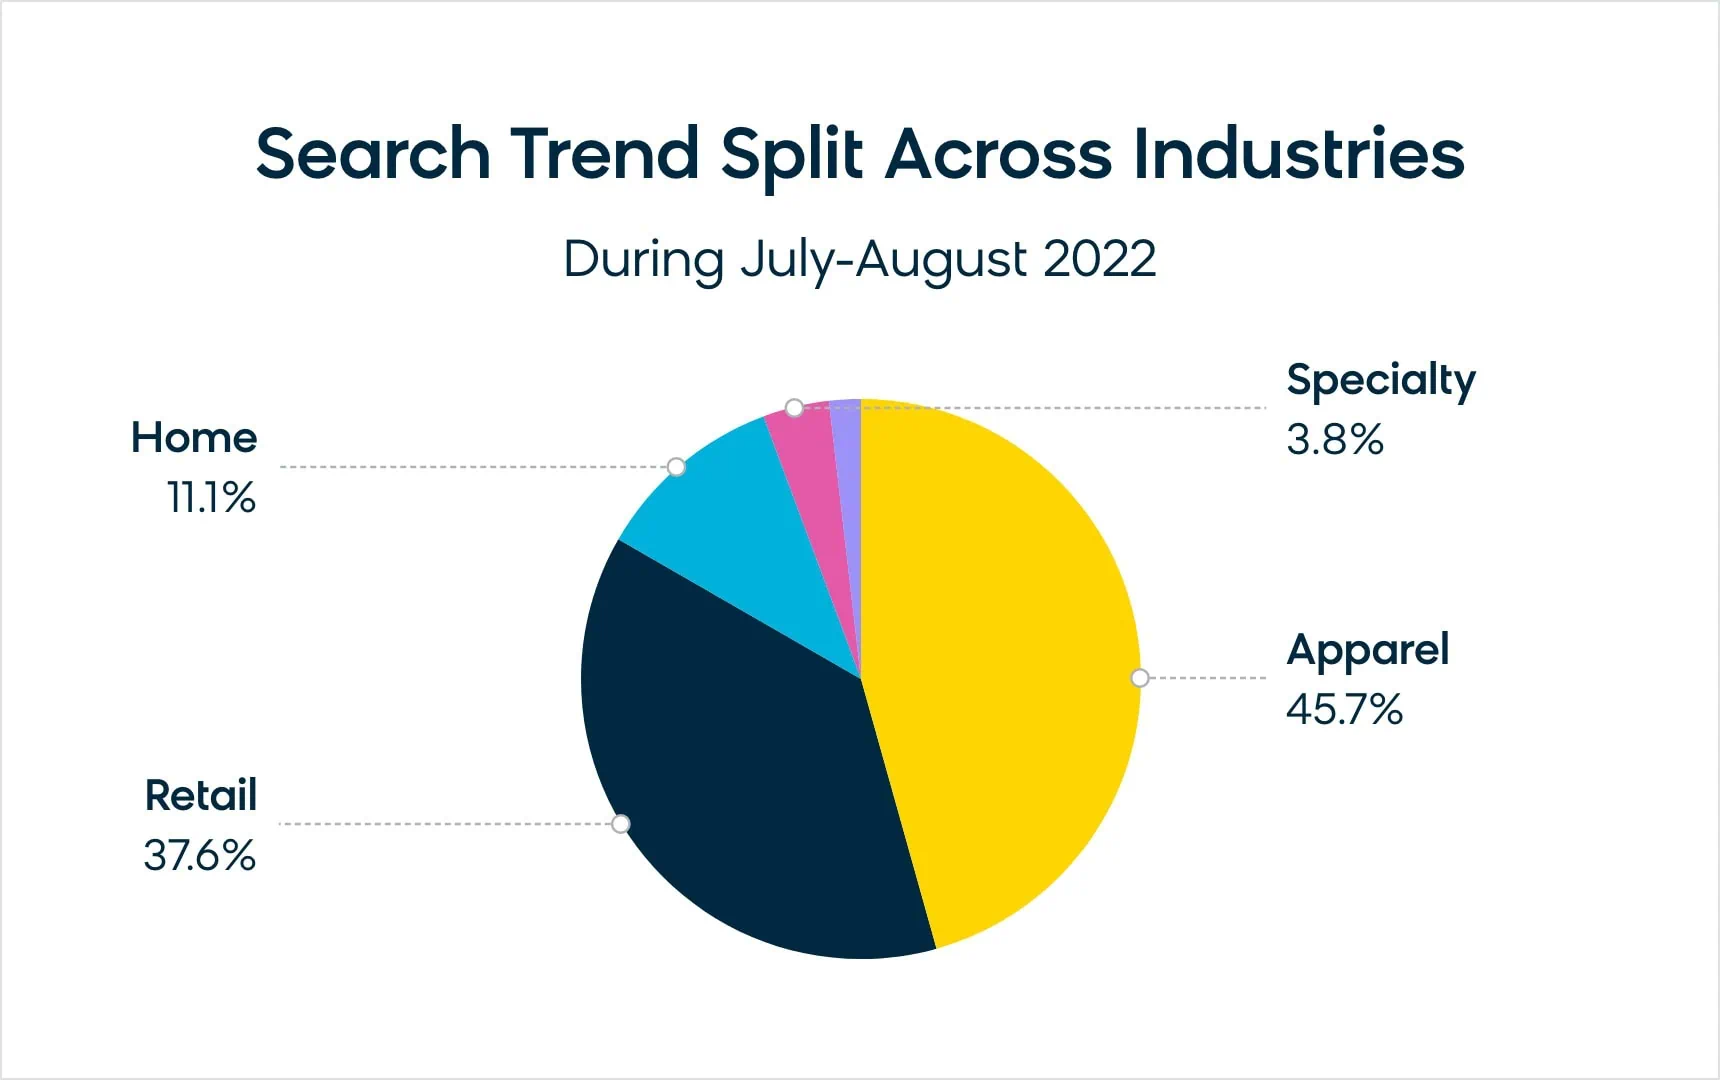
In apparel, category revenue contribution was 42.80%. That’s almost half of all revenue going through your merchandising experience during this time! If you’re leveraging landing pages for back to school, make sure the messaging follows through the full funnel from home to product grid to PDP. When optimizing your merchandising experience, here are some things to add to your merchandising checklist:
- Optimize low-converting category pages
- Review high exit-rate category pages
- Check to ensure all products are merchandised within your category structure
- Review high next-search pages
- Stay on top of trending categories
- Think about your top audiences and create experiences to meet their expectations
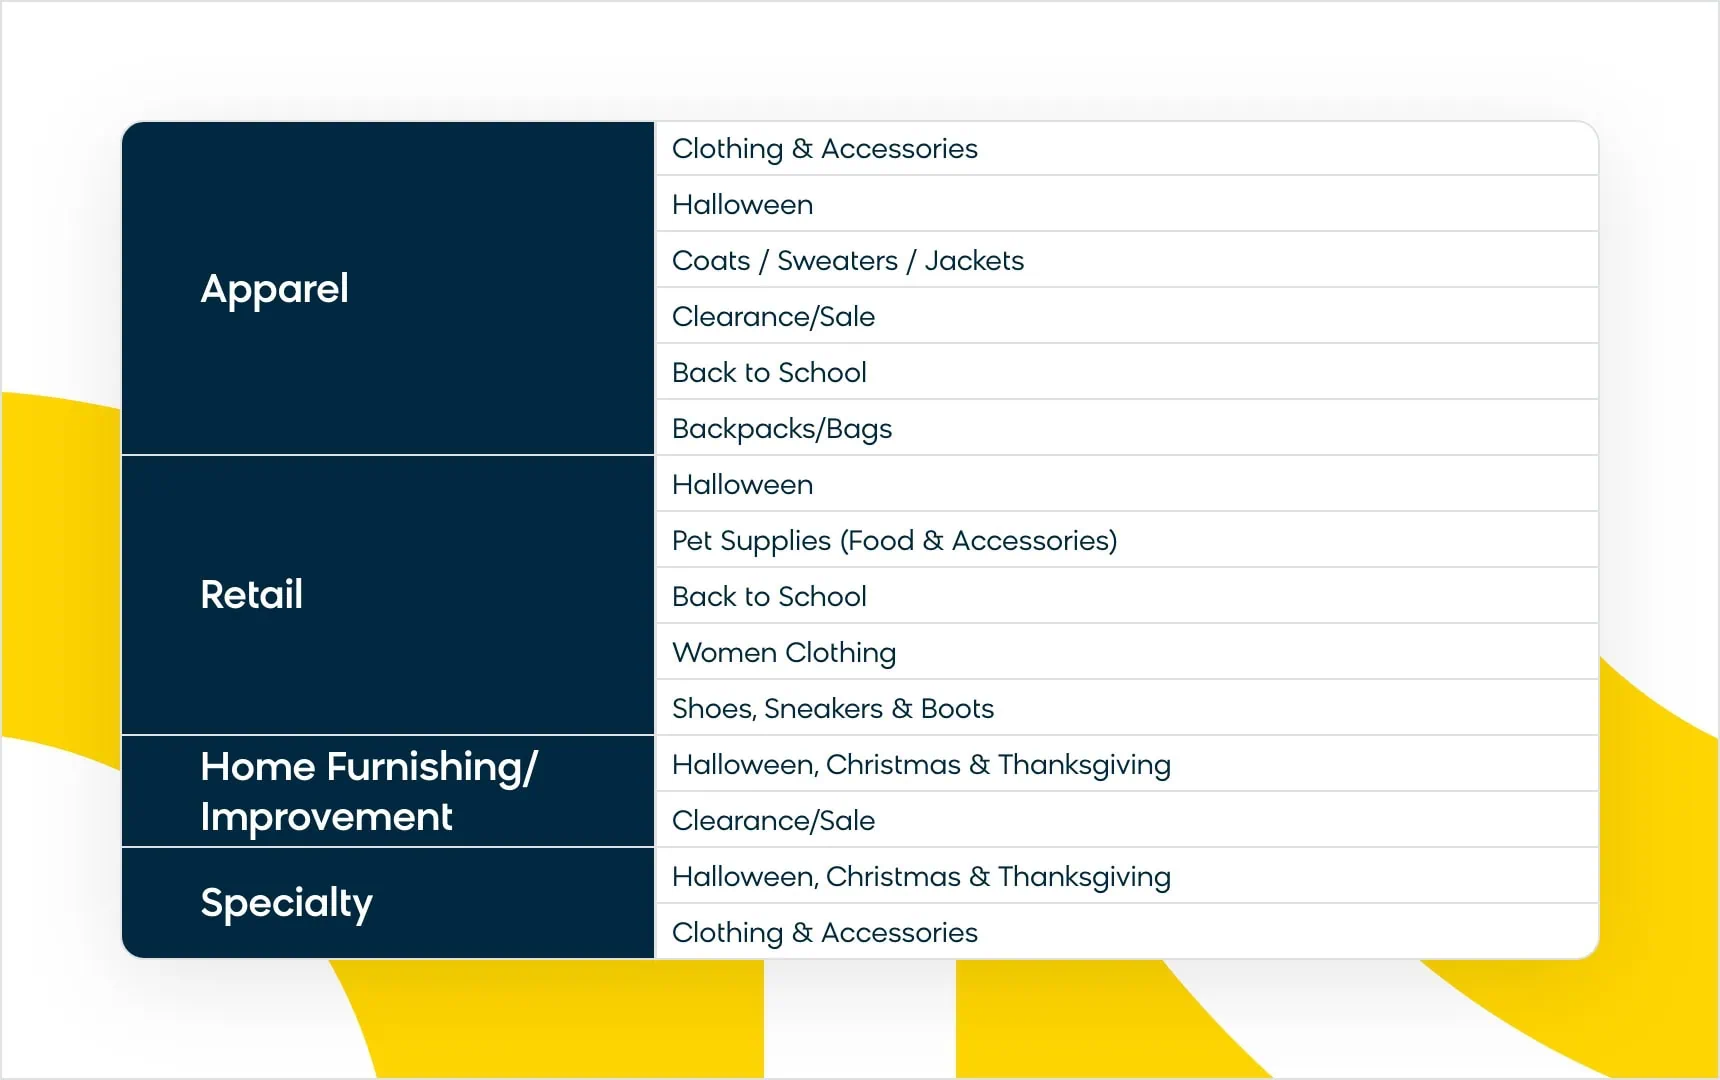
Categories with increases in traffic in August/September compared to June/July include:
Holiday Shopping Has Already Begun
As we assess back-to-school purchase data and consumer behavior, it’s very clear that customers are already thinking about holiday season prep. Customers have already started exploring options for Halloween, Thanksgiving, and Christmas (especially Christmas in the home industry).
This back-to-school season, our merchants should not only prepare for school reopening, but also showcase holiday-related banners, offers, and products. In particular, Halloween should be the next focus since items in that category are not only being browsed, but we can see they’re being purchased early on.
For more insights into how you can use back-to-school data to build successful holiday campaigns, be sure to read more from the Experience Strategy Group here at Bloomreach. If you’re interested in more on back-to-school campaigns, download our free checklist to learn more.


