
Email marketing analytics and key performance indicators (KPIs) can be measured in many ways.
Look at any email marketing tool and you’ll find dozens of email KPIs you can use and monitor. But blindly trusting these metrics can result in misinterpreted data and bad decisions.
To actually succeed with your email marketing KPIs, you need to focus on two things: email deliverability (your ability to get emails delivered to your recipient’s inbox) and content performance (your ability to convince the recipient to reach the goal you set up).
Here are the most important email marketing KPIs for measuring the success of your email marketing strategies, along with benchmarks to help you understand what numbers you should aim for in 2026.
How to Measure Email Marketing Success
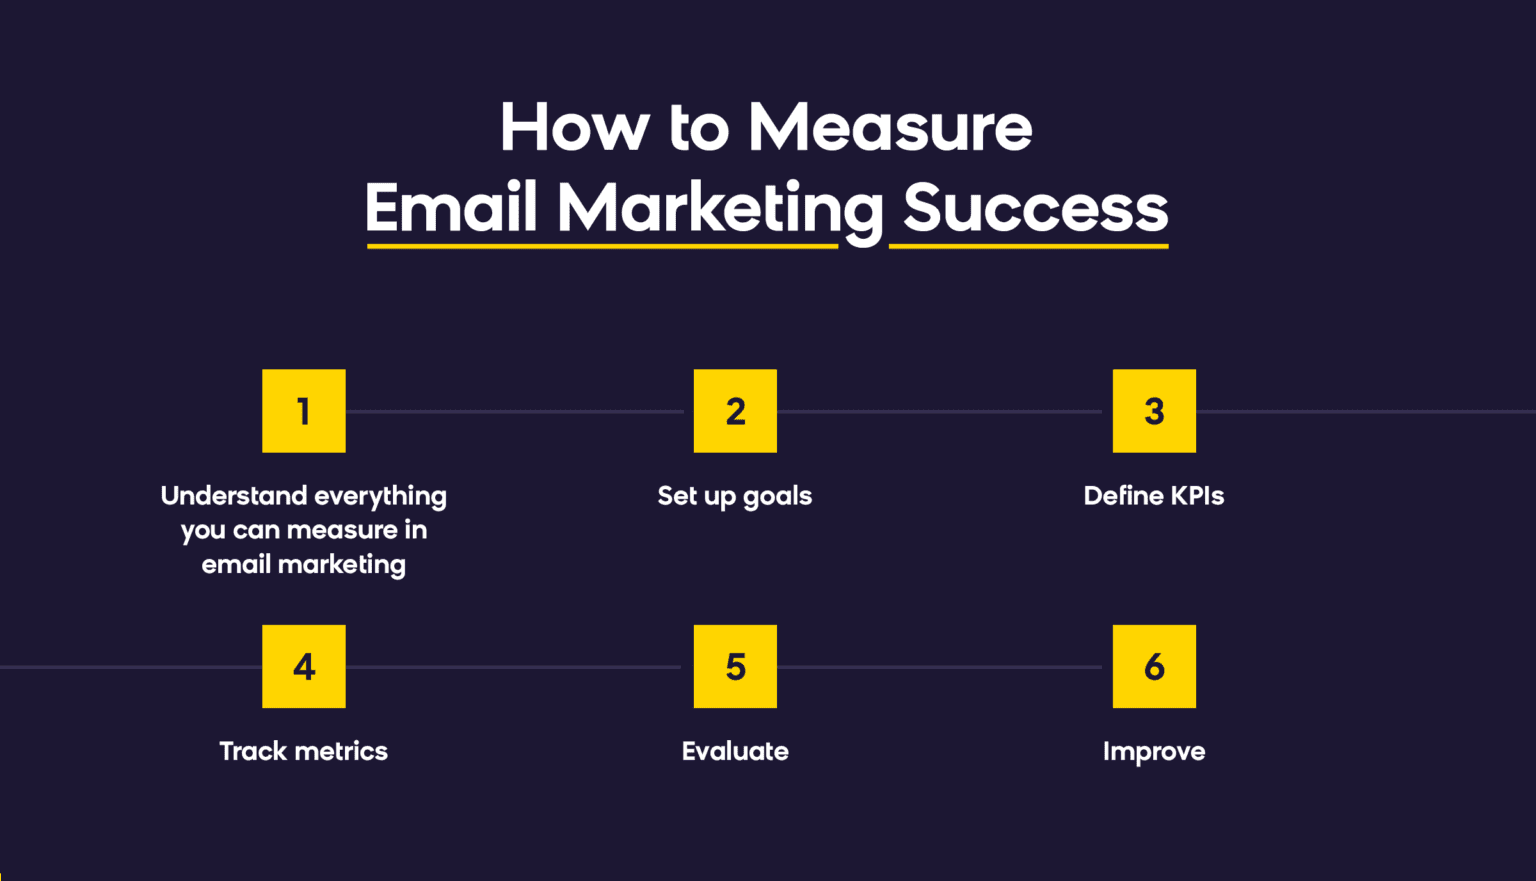
Step 1. Understand Everything You Can Measure in Email Marketing
Understand what KPIs can be measured, what pitfalls you can encounter when evaluating them, and what decisions the email marketing metrics can lead to.
Step 2. Creating Goals
What are your email marketing goals? Do you use it for customer reengagement, for sending bulk newsletters, or for targeting individuals with ecommerce personalization tactics based on their most recent behavior?
Different email marketing campaigns will have different goals. You should not expect every email to bring you revenue. Sometimes, all you are looking for is to reengage with the customer and explain your unique selling propositions, hopefully leading to a purchase later.
Step 3. Define Your Email Marketing KPIs
Once you understand your email campaign metrics, you can start with defining the KPIs. It’s important to focus on both “positive” KPIs, such as revenue uplift or open rate uplift, as well as “negative” KPIs, such as keeping your unsubscribe rate low.
Step 4. Track Email Marketing Metrics
Tracking metrics should be automatic with most modern email solutions, or customer data platforms (CDPs) that offer execution. The benefit of using a CDP is that you can see all email related actions in a single customer view.
Step 5. Evaluate
Evaluating email marketing KPIs can be tricky. Some of them need to be looked at daily, some weekly, and others you can only check monthly.
Check these daily: open rate, open-rate variation, bounce rate, and soft-bounce rate. These metrics might help you spot incoming problems.
Check these weekly: overall email campaign performance, email campaign conversion & revenue reporting, click-through rates, spam-complaint rates, unsubscribes and active audience trend.
Check these monthly: opens per customer, revenue per customer, mobile open rate, email client share, spam score checks.
Step 6. Improve
Knowledge of benchmarks will help you prioritize what needs to be improved. If you don’t like your conversion rates for a newsletter, but you’re still beating benchmarks, then there might be another area to focus on where you can get a bigger improvement for the same effort.
To set up a email marketing strategy, you have to be confident in the numbers you see reported. You have to understand how the metrics influence each other and what could go wrong by trying to improve one area.
It’s completely normal to feel overwhelmed by the sheer size of the reports, there are lots of different metrics, and it’s difficult to even know where to start. If you feel this way, start at the beginning of the funnel: your customers, your audience criteria, and your email frequency.
Once you’re happy with this part of the funnel and you’re getting results you like, you can move on to the next steps: delivery rate, open rate, click rate, and eventually revenue.
Remember that you’ll need to be patient. Big changes, especially in email marketing, take time. Set reasonable timelines and don’t expect miracles after two email marketing campaign sends. Email marketing is a complex system, and it depends on more than just your performance. There are external factors at play. You need to test and find what works for you, your goals, your customers, the mailbox providers, and those trying to fight spam.
But before you do anything else, you need to understand email marketing KPIs. So let’s take a look at what they are and how they’re defined.
15 Essential Email Marketing KPIs to Track in 2026
Before you even send an email marketing campaign and start measuring metrics, you need to understand the audience that you market to. Here are the 15 most critical KPIs every email marketer should monitor:
1. Email Audience Trend
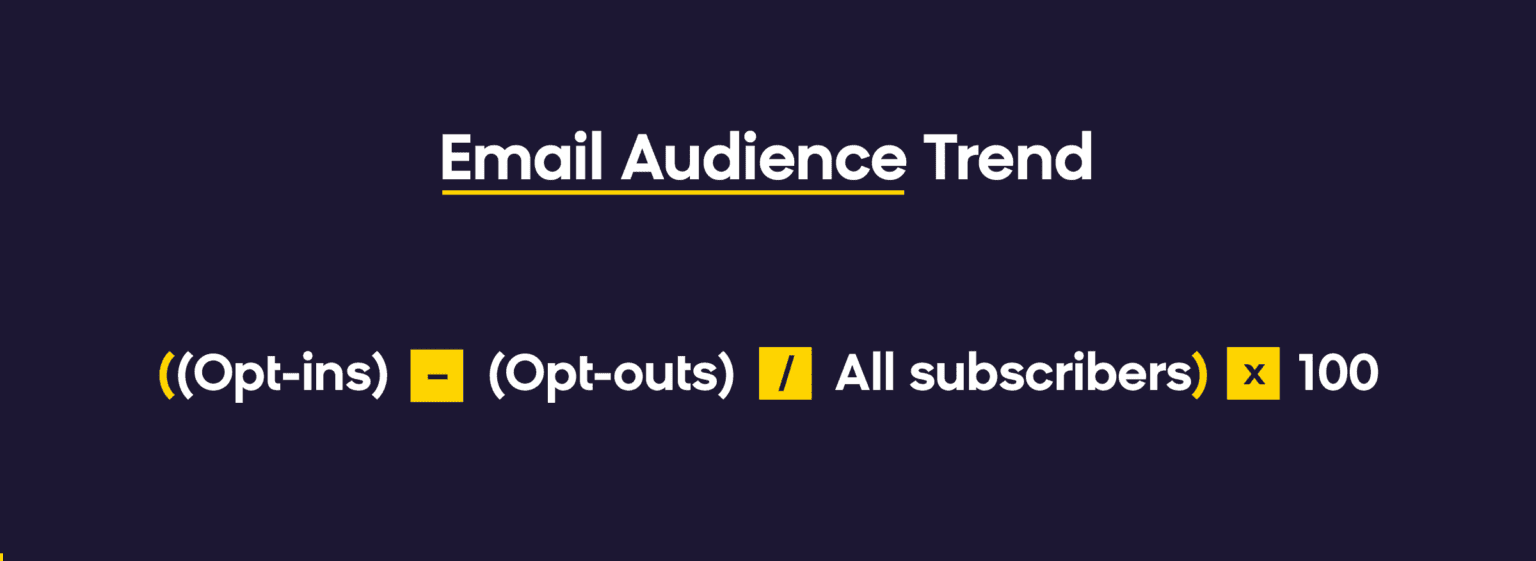
As you gain subscribers, you also lose subscribers. This is a natural process. Knowing that your audience is declining, and knowing this early, will help you prevent bigger revenue issues months down the line. It enables you to take actions, to understand why subscribers are leaving, and what you need to change.
Why it matters: Early detection of audience decline prevents future revenue losses and helps identify underlying issues with your email strategy. Research shows email lists naturally decay at approximately 22.71% annually, or about 1.89% monthly, so some churn is expected.
2026 Benchmark: Monitor monthly growth/decline rates. A decline exceeding 2-3% monthly runs ahead of that natural baseline and warrants investigation.
2. Active Audience Trend
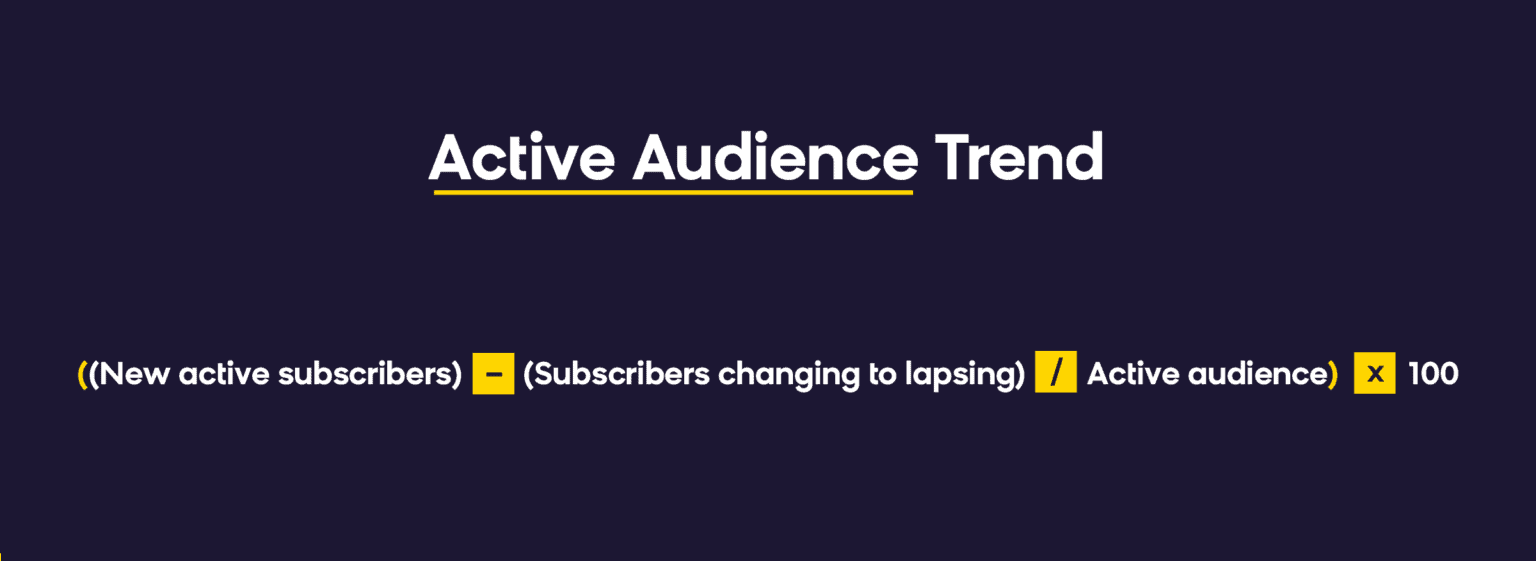
It’s also vital to monitor the growth or decline of your active audience. These are the subscribers that engage with most of your emails, bring the most revenue, and are the only ones with whom you should communicate with a high frequency.
Catching any issues early and setting up a good re-engagement program should help you avoid any shrinkage of your active audience.
Why it matters: Active subscribers generate the majority of email revenue and engagement.
2026 Benchmark: Active audience should represent 20-30% of your total subscriber base.
3. Delivery Rate

Delivery of an email is usually the first thing measured. It means that your email was accepted by the recipient server. In the case of a bigger deliverability issue, you would see your delivery rate drop, which might indicate that you are being blocked completely.
As long as your database is clean, you should be achieving a 97-99% delivery rate, although you might see lower delivery rates on programs such as double opt in or a welcome program, where new email addresses enter your list.
A delivery rate below 95% should get your attention. You might need to check how you’re collecting email addresses. Using real-time validation for collection can be helpful here.
Why it matters: Low delivery rates indicate serious deliverability issues that can impact your sender reputation.
2026 Benchmark: Target 97-99% delivery rate; investigate if below 95%.
4. Hard Bounce Rate

The bounce rate informs you about hard bounced emails: addresses that are permanently unreachable. You should automatically exclude any bounced addresses from your list. Failure to do so will lead to your emails being blocked completely.
A high bounce rate can be caused either by already being blacklisted, or more commonly by sending to invalid email addresses. Sending emails to an invalid email address can also cause a myriad of other issues.
Why it matters: High bounce rates damage sender reputation and can lead to complete blocking by email providers. According to cross-industry research, anything below 2% is considered normal, 2-5% is warning level, and above 5% is critical.
2026 Benchmark: Keep below 2%; investigate immediately if above 5%.
5. Soft Bounce Rate

Your soft bounce rate informs you about temporary issues in your emailing. This doesn’t mean it’s not important to monitor, as it can hint at bigger issues. If you ignore these warnings, you will eventually encounter hard bounces and a drop in delivery rates.
Frequent causes for soft bounces are temporary blacklisting, full mailboxes, connection errors, and greylisting. To avoid these, make sure your email list is clean and that you use best sending practices.
Why it matters: Soft bounces can indicate temporary deliverability issues that may become permanent if not addressed.
2026 Benchmark: Aim for less than 2% soft bounce rate; monitor trends for early warning signs.
6. Open Rate
Open rate is the second most important email deliverability metric. It shows you that emails are reaching the customers inbox, and that either the brand or the subject line caught their attention. Most brands calculate this as unique opens, since counting all opens can skew the results.
As of 2026, the average email open rate across industries sits around 37% — though figures vary across data sources, with reported averages spanning the low 30s to low 40s depending on industry mix and methodology. Senders with good list health and an engaged audience typically reach 30-40% open rates on bulk emails. The golden standard to reach is at least 20%+.
On automated or triggered personalized email marketing campaigns, you might see open rates between 40% and 70%. This is possible with smaller audiences, microsegmenting, and very relevant content.
Why it matters: Open rates indicate both deliverability success and subject line effectiveness.
2026 Benchmark: 20%+ for bulk emails, 30-40% for well-segmented campaigns, 40-70% for triggered emails.
7. Total Open Rate

This metric will help you understand how many customers are coming back to reopen an email. This is helpful for finding out whether customers are returning to emails with, for example, USPs or loyalty program information.
Why it matters: High total open rates indicate valuable, reference-worthy content.
2026 Benchmark: Total opens should typically be 10-20% higher than unique opens for valuable content.
8. Open Rate Variation
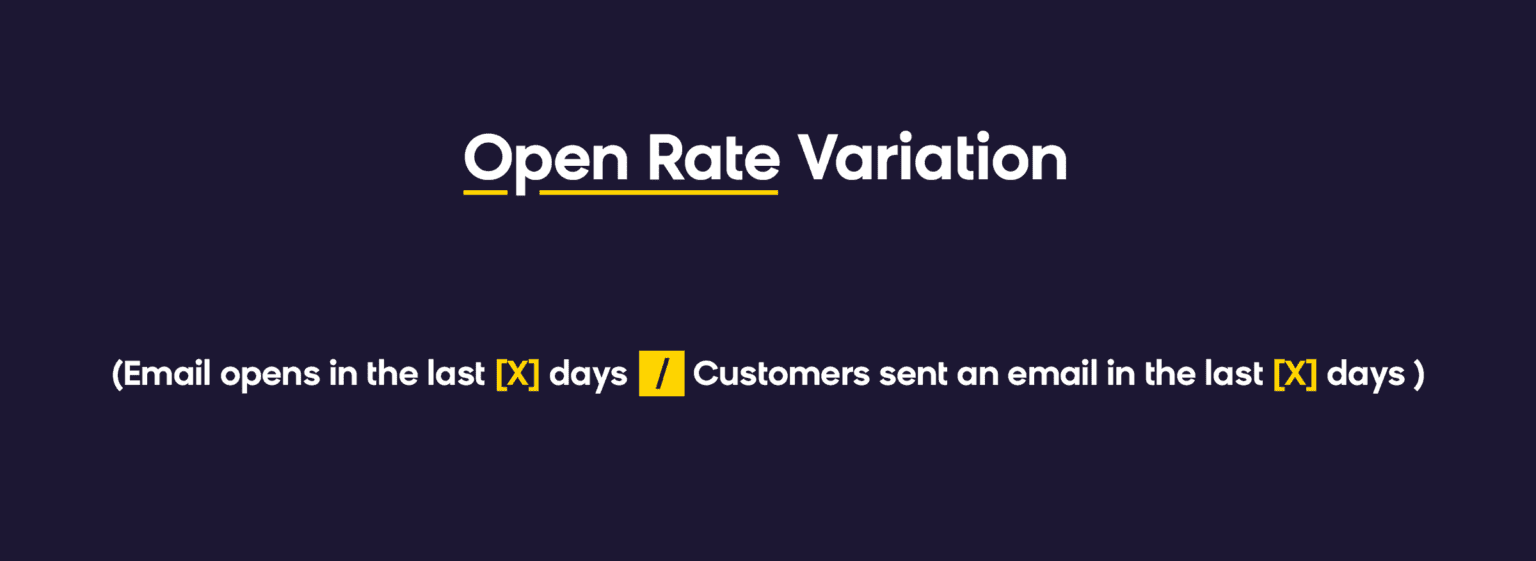
When you compare open rate results between different domains, you might see that one domain is performing much worse than your best performing one. For example, Gmail might have open rates of 30%, but Hotmail only reports 14%. This would hint at inbox placement issues with Hotmail.
Why it matters: Significant variations between email providers indicate deliverability issues with specific providers.
2026 Benchmark: Investigate if variation exceeds 30% between major email providers.
9. Opens Per Customer
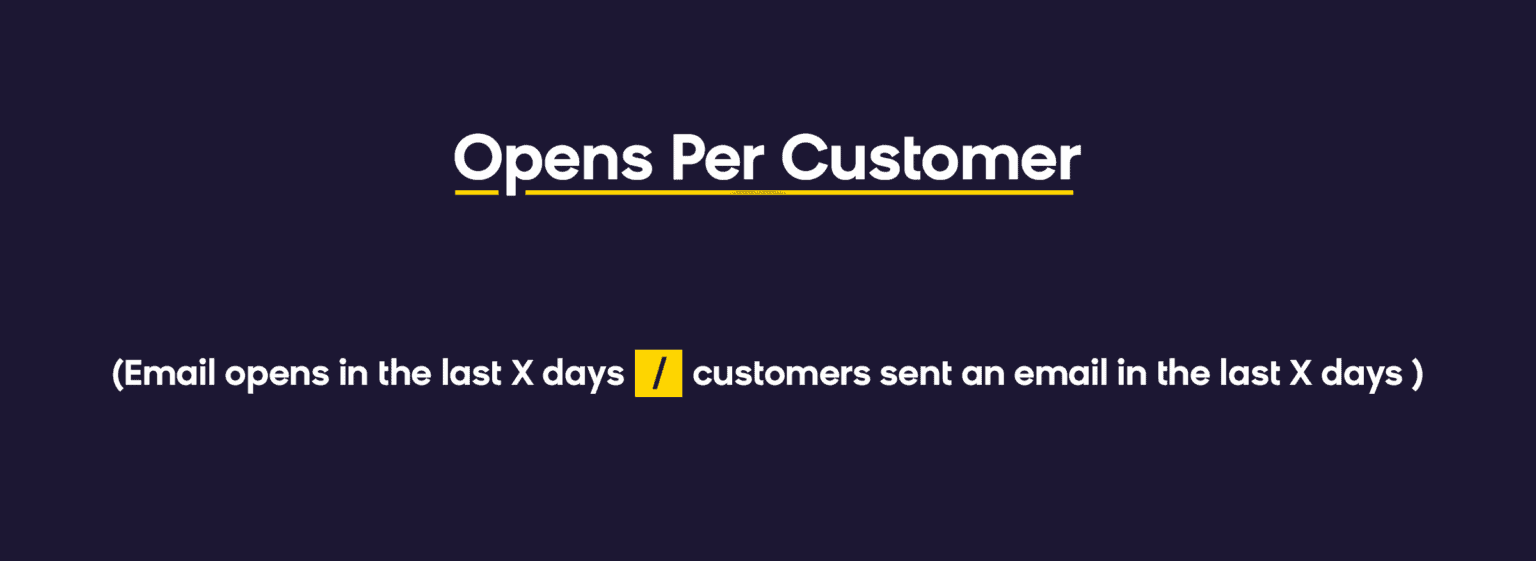
This metric is handy if you are trying to adjust your email frequency. Select a time period for which you are calculating the metric (we usually look at the last seven or 30 days) depending on how engaged the audience is and how frequently you are sending already.
Why it matters: Helps optimize email frequency and prevent over-communication.
2026 Benchmark: Varies by sending frequency; if sending 15 emails monthly but averaging 1.6 opens per customer, reduce frequency.
10. Engagement Time

Understanding when your customers are engaging with your emails can prove helpful for email campaign timing and getting better conversion rates. You should send emails when customers are ready to open them, which can vary a lot from individual to individual.
Why it matters: Optimal send timing can significantly improve open and conversion rates.
2026 Benchmark: Analyze individual customer patterns; peak engagement times vary by audience.
11. Mobile Open Rate

Are you optimizing content for desktop, mobile, or both? Do you properly test all major mobile devices? You might find you are spending a lot of time optimizing your emails for the 0.1% of your subscribers that use Outlook, but the majority of your revenue might come from the 70% of your subscribers that are iPhone users.
Why it matters: Mobile optimization priorities should align with your audience’s device usage patterns. Mobile email open rates vary from 26-78% depending on industry and audience demographics.
2026 Benchmark: Mobile typically accounts for 50-65% of email opens across most industries, with higher rates among younger demographics.
12. Click-Through Rate
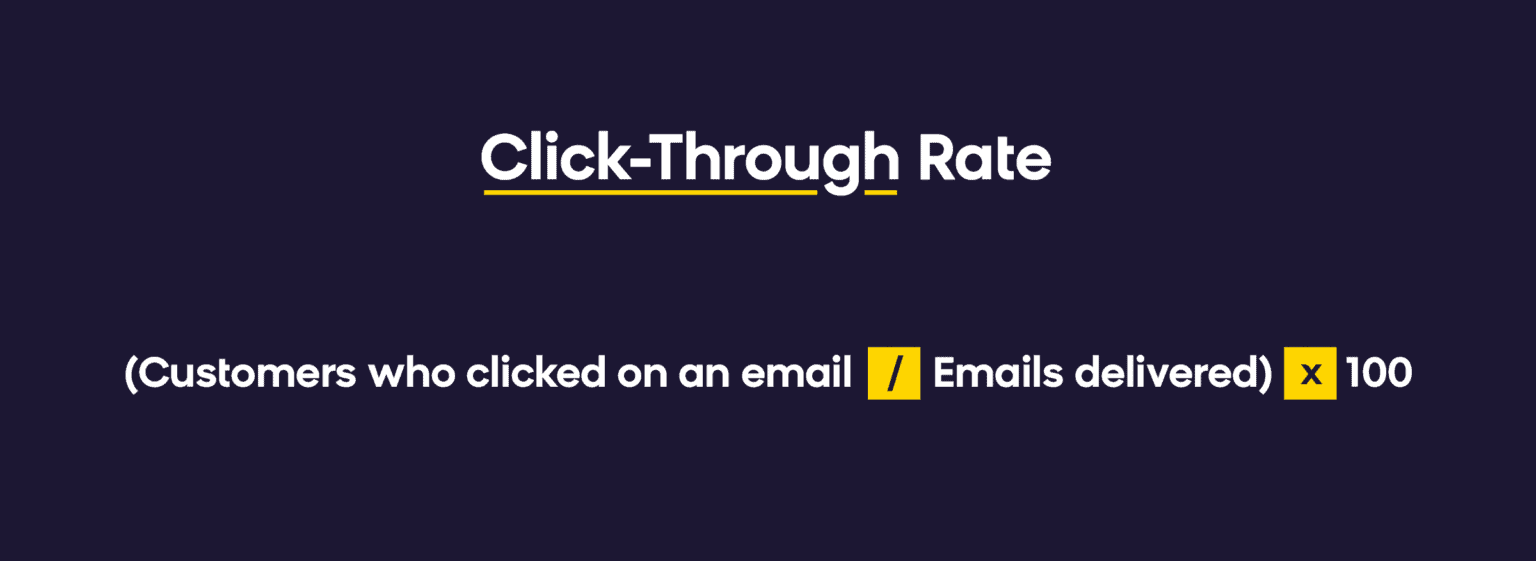
This metric shows how many customers, out of all those that received an email, clicked on the content. This is essentially reporting on two things at once: how many customers opened an email and how many clicked.
Why it matters: CTR measures overall campaign effectiveness combining deliverability and content performance. According to current benchmarks, anything above 2% is considered strong across most industries.
2026 Benchmark: Target 2%+ CTR; industry averages typically range from 1.3-2.7% depending on sector.
13. Click-to-Open Rate
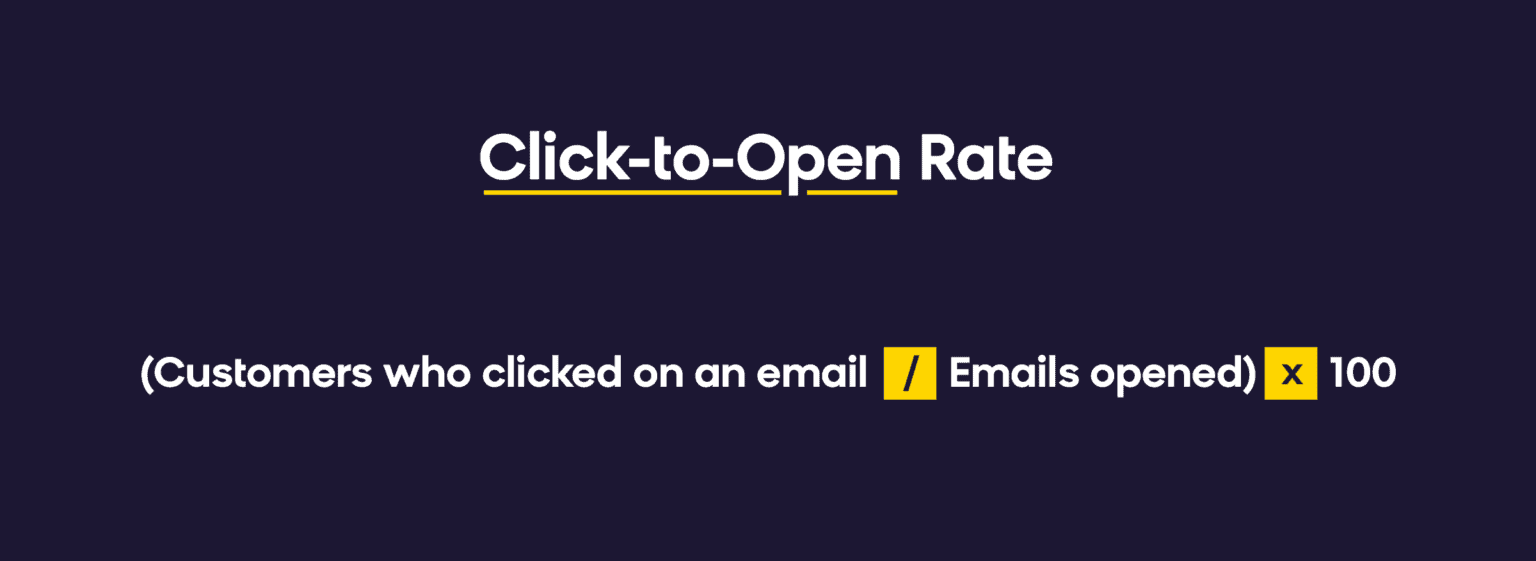
While similar to the previous metric, this metric is calculated based on emails opened rather than delivered. This means it better reflects the performance of the content of your email.
Why it matters: CTOR isolates content performance from deliverability issues. A good CTOR typically ranges between 20% and 30%.
2026 Benchmark: Target 20%+ CTOR for well-performing email content, with 25-30% representing excellent performance.
14. Unsubscribe + Spam Complaint Rate Per Email
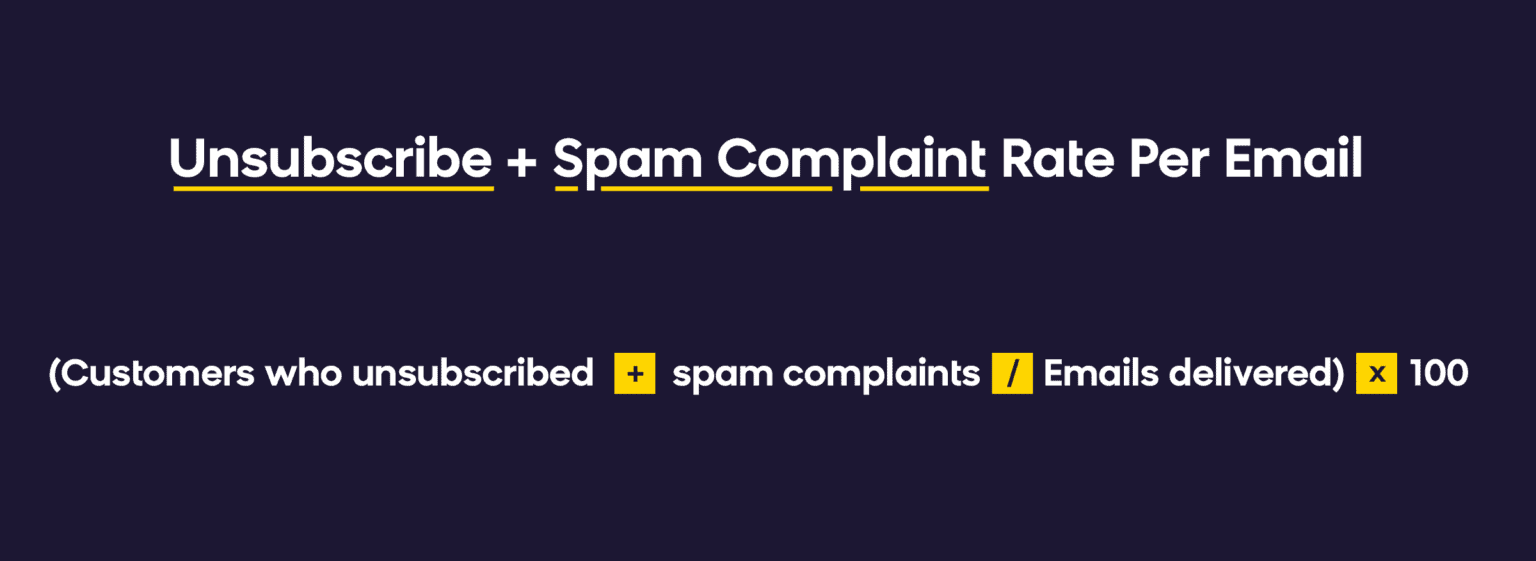
Reporting on unsubscribes is important for understanding the other side of the email business: how many people completely lost interest in your email marketing efforts, or worse, your brand?
Why it matters: High unsubscribe rates indicate content relevance or frequency issues.
2026 Benchmark: Keep unsubscribe rates below 0.3%; spam complaints below 0.01% (with Google/Yahoo requiring under 0.1%).
15. Conversions & Revenue & AOV
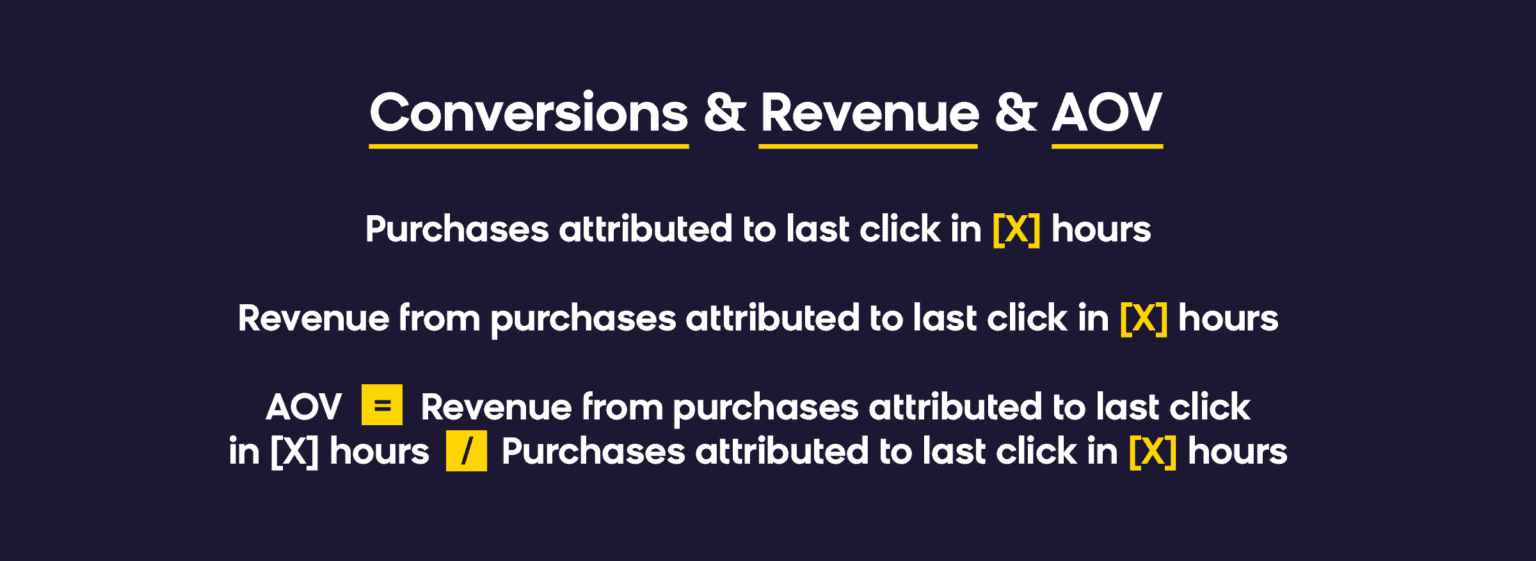
The correct attribution of conversions will make or break your email marketing ROI reporting. Most companies today use last-click attribution, with an attribution window of 24 hours or three days, depending on email frequency.
Why it matters: Revenue metrics directly tie email performance to business outcomes.
2026 Benchmark: 1%+ conversion rate for newsletters, 3-5%+ for triggered emails, up to 15%+ for highly targeted campaigns like abandoned cart flows.
Email Marketing KPI Summary Table
Use this table as a quick reference to check which metrics to prioritize, what benchmarks to target, and how often to review each. The sections above explain what drives each figure and what to do when you fall outside the benchmark range. For live figures broken out by your own vertical, see our marketing benchmarks, built from real Bloomreach customer sends rather than survey data.
|
Metric |
What It Measures |
Benchmark (2026) |
Check Frequency |
Source
|
|---|---|---|---|---|
|
Email Audience Trend |
Total subscriber growth/decline |
<2-3% monthly decline |
Monthly |
|
|
Active Audience Trend |
Engaged subscriber base size |
20-30% of total list |
Monthly |
Bloomreach |
|
Delivery Rate |
Emails accepted by receiving server |
97-99% |
Daily |
|
|
Hard Bounce Rate |
Permanently undeliverable addresses |
<2% |
Daily |
|
|
Soft Bounce Rate |
Temporary delivery failures |
<2% |
Daily |
|
|
Open Rate |
Emails opened / delivered |
Industry avg ~37%; 20%+ bulk; 30-40% segmented; 40-70% triggered |
Weekly |
|
|
Total Open Rate |
Repeat opens per email |
10-20% above unique opens |
Weekly |
Bloomreach |
|
Open Rate Variation |
Open rate gap between email providers |
<30% gap between providers |
Daily |
Bloomreach |
|
Opens Per Customer |
Average opens per subscriber in a period |
Adjust frequency if <2 opens/15 sends |
Weekly |
Bloomreach |
|
Engagement Time |
When subscribers open and click |
Varies by audience; use to time sends |
Monthly |
Bloomreach |
|
Mobile Open Rate |
Opens on mobile devices |
50-65% of total opens |
Monthly |
Bloomreach |
|
Click-Through Rate |
Clicks / delivered |
2%+ target; 1.3-2.7% industry range |
Weekly |
|
|
Click-to-Open Rate |
Clicks / opens |
20%+ target; 25-30% excellent |
Weekly |
Bloomreach |
|
Unsubscribe + Spam Complaint Rate |
Opt-outs and spam reports per send |
Unsubs <0.3%; spam <0.01% |
Weekly |
|
|
Conversions & Revenue & AOV |
Goal completions and revenue / delivered |
1%+ newsletters; 3-5%+ triggered; up to 15%+ cart flows |
Weekly |
|
|
Email ROI |
Revenue return per $1 spent |
$36-42 per $1 spent |
Monthly |
Widely cited benchmark |
Email ROI figures reflect widely cited industry benchmarks; track your own return monthly alongside revenue-per-email to catch any drop in campaign efficiency early.
Top Email Analytics Tools and Integrations
Choosing the right email marketing analytics tools and integrations is crucial for comprehensive email performance tracking:
Native Email Platform Analytics: Most email service providers, including Bloomreach, offer built-in analytics dashboards with real-time reporting, segmentation analysis, and automated insights. These provide the foundation for email performance tracking.
Google Analytics 4 Integration: Connecting your email campaigns to GA4 enables cross-channel attribution, audience behavior analysis, and revenue tracking beyond email clicks. This integration provides deeper insights into customer journeys.
CRM Integration (Salesforce, HubSpot): Integrating email analytics with your CRM system allows you to track lead progression, customer lifecycle metrics, and sales attribution directly from email campaigns.
Business Intelligence Tools: Connecting email data to BI platforms like Tableau or PowerBI enables advanced reporting, custom dashboards, and executive-level insights combining email performance with broader business metrics.
Custom Dashboard Solutions: Many businesses create custom analytics dashboards that combine email metrics with other marketing channels, providing a unified view of marketing performance and ROI across all touchpoints.
Common Email Analytics Mistakes to Avoid
Avoid these frequent pitfalls that can lead to misinterpreted data and poor decision-making:
- Focusing on Vanity Metrics: Prioritizing open rates over conversion rates and revenue can lead to strategies that generate engagement without business impact.
- Ignoring Segmentation Analysis: Analyzing overall performance without segmenting by audience, campaign type, or customer lifecycle stage misses critical optimization opportunities.
- Poor Attribution Tracking: Using incorrect attribution windows or failing to track cross-device conversions leads to undervaluing email’s true impact on revenue. Proper attribution setup is crucial for accurate ROI measurement.
- Neglecting Data Hygiene: Failing to regularly clean email lists, remove hard bounces, and suppress unengaged subscribers skews all performance metrics.
- Short-Term Evaluation Periods: Making strategic decisions based on single campaign results rather than analyzing trends over appropriate time periods.
- Overlooking Mobile Analytics: Failing to analyze mobile-specific metrics when mobile accounts for a significant portion of email opens leads to suboptimal user experiences.
A disciplined email marketing analytics strategy that avoids these mistakes keeps your decisions grounded in accurate, actionable insights.
Email Marketing Goals
Your emailing goals don’t need to be entirely based on metrics. They can be based on something more abstract, like wanting to include more personalization in your newsletters. The important thing is that your results need to be quantifiable and measurable. You will need to set different KPIs based on which metrics are important for your goals.
Let’s look at some goals that email marketers frequently set. We’ll start with the most complex and work towards more specific ones. We’ll also give you some KPIs to focus on for each goal.
Goal: Increase Email Marketing Revenue by X% in Y months
This is the most common, but also the most complex, goal that you can set for yourself. It is influenced by many factors, so it is usually wiser (and easier) to break it down into smaller steps and multiple KPIs.
Let’s start at the end of the funnel: a conversion. Conversions on the web or in an app can come from email in two ways: either directly from a click in an email, or indirectly (a customer gets an email but doesn’t make a purchase immediately, but later they remember the content from the email and come directly to the site to make a purchase).
There is no straightforward way to measure email’s influence on the latter scenario, so we need to start with a quantifiable goal: an increase in clicks and click-to-open rate.
You can improve these email metrics with the following tactics:
Test Your Email
Test the content, formatting, and images on multiple devices. Make sure your readers can engage with the content once they open the email.
Make it Easy to Convert
Don’t hide a button at the bottom of the email. Highlight the conversion goal multiple times and work on your CTA button – it’s your moneymaker. Set the right expectations at this stage.
Personalize
Make the content personalized and relevant to the customer, whether that means targeting based on their favorite category, or using advanced recommendations that choose the best products for that target audience member. This tactic is usually the most effective one.
Let Customers Give Feedback
This can be done by encouraging a direct email reply (you might have noticed that “noreply@brand.com” emails are slowly disappearing), giving customers a simple poll, or setting up a customized preference control center that allows customers to select the topics they are interested in and set the frequency with which they’ll receive emails.
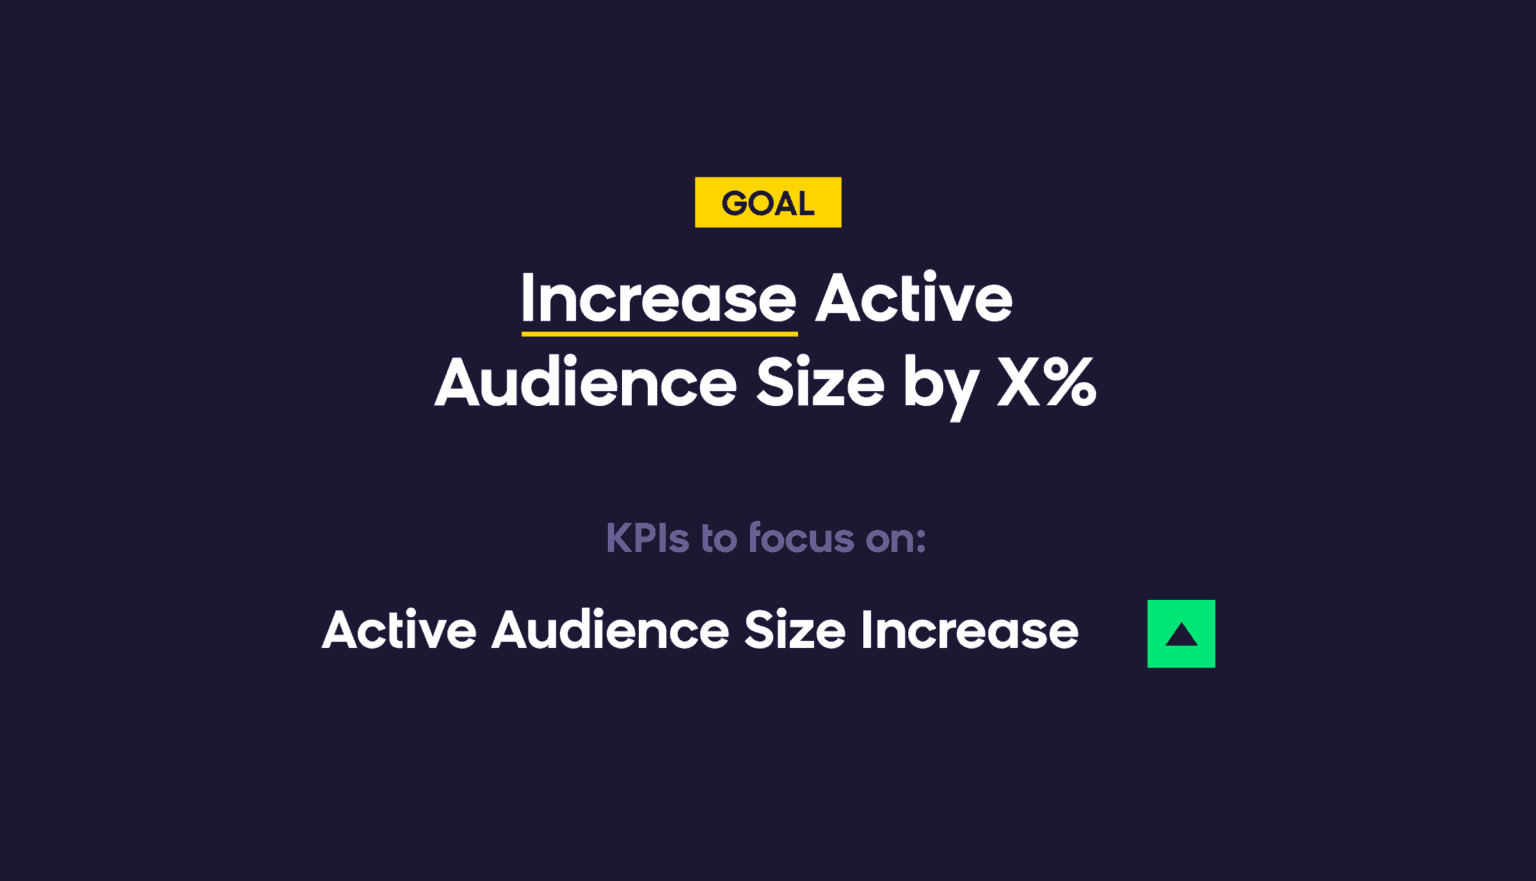
Goal: Increase Active Audience Size by Y%
Increasing Engagement
Two things influence your active audience size: customers becoming part of your active audience by engaging with an email, and customers leaving it by not engaging.
Start by improving your sign-up process. Is it as simple and straightforward as GDPR allows? Are the customers clear on what they are signing up to? Once they sign-up, do they receive a welcome email that sets expectations for the content they will start receiving from that day? If they don’t open the email, do you try to re-engage them with personalized communication, or do you just start churning out newsletters?
Reengaging Customers
Do you make sure that customers have a good reason to reengage? If you know a customer is about to leave your active audience, there are a few things you can try. Like offering an incentive, showing what they missed out on by not opening your emails.
Make sure to capture customers with reengagement campaigns not just at the 90-day mark, but at different times, too: 150 days, 180 days, a year. Don’t be afraid to A/B test various incentives and messaging at this stage.
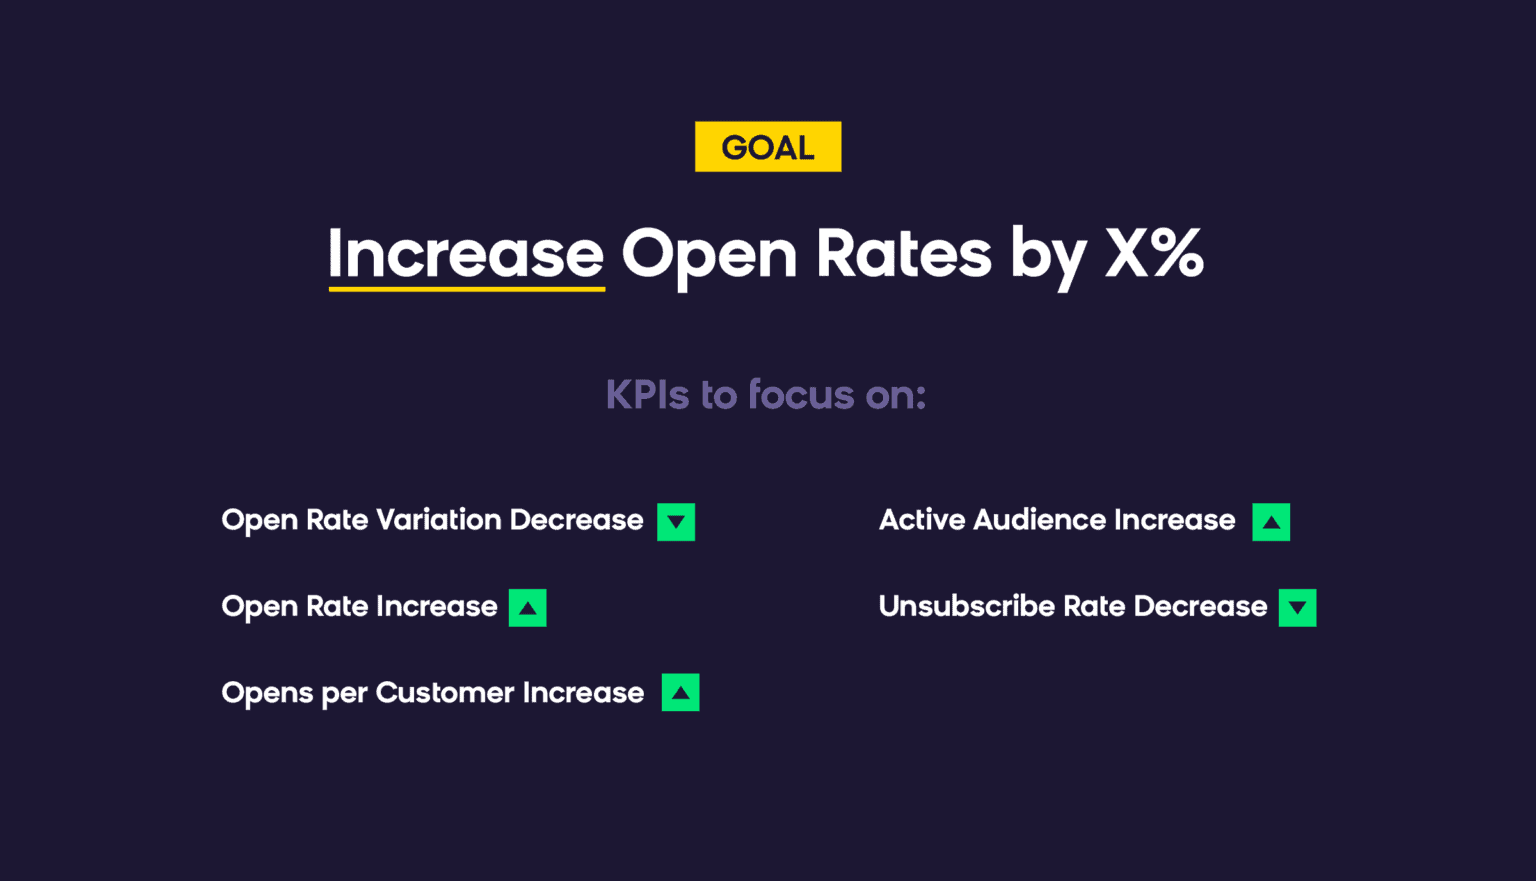
Goal: Increase Open Rates by X%
The open rate metric can be quite misleading, and the overall number doesn’t tell you the whole story. It’s important to establish a benchmark between different mailboxes. This rules out any deliverability issues before you try to improve content.
If the variation in open rates for different mail providers is more than 30%, e.g. Gmail reports an open rate of 20% while Hotmail reports 11%, you should focus on improving your inbox placement with Hotmail.
If you are sure you don’t have any major deliverability or inbox placement issues, you can proceed with content improvements. Anything the customer sees is fair game for improvement.
Here are some items worth checking:
“From” Name
Is it obvious at first sight who the email is from? Try A/B testing which branding works best for you (using a personal name in the “From” might work for some more informal brands, e.g. Peter from Bloomreach).
Most of the time, keeping it simple is the winning variant. People like consistency, so don’t change the sender name too often. This might get you incorrectly flagged as a phishing or scam attempt by the recipient.
Subject Line
Here you can really flex your creative muscles. This is the most visible element of the email, so make it personal. Use any knowledge of the customer you have to make the subject line relevant, but not creepy. Focus on the brands, categories, and products the customer likes. If possible, do an automatic A/B test for 3-4 variants on a small portion of your database, wait for a few hours, and then send the winning variant to the rest of your customers.
Pre-header and Preview Text
Although slightly less visible than the subject line, customers still notice it. Make sure to use this space to “preview” what the content of the email will be like. You definitely shouldn’t show the following message: “If you can’t see the email properly, click here to view in browser”, this is a waste of valuable space.
Send Time
This influences where your email is in the inbox. If you send your email at 6 AM, and the customer usually checks their emails after work, you might already be in the 10th position. You need to use your knowledge of when a customer opens their emails and be sure you land at the top of the inbox.
All of these improvements will lead to an increase of open rates. Of course, the person you’re sending to is also important. When it comes to the recipient, the same principles from the previous goals apply: be careful not to over communicate, be relevant to the individual customer, and make sure the frequency is acceptable.
Essential Email Marketing Reports for Tracking Performance
Knowing which email marketing reports to pull, and how often, is what separates reactive marketers from strategic ones. The reports below map directly to the KPIs above: each one surfaces a specific layer of performance data, from deliverability health to revenue attribution. Use them together to build a complete picture of your email program.
There are two major reports that will tell you most of what you need to know about your email performance, including both deliverability performance and campaign performance. These reports were created in Bloomreach, but you should be able to recreate them in the email marketing analytics program of your choice.
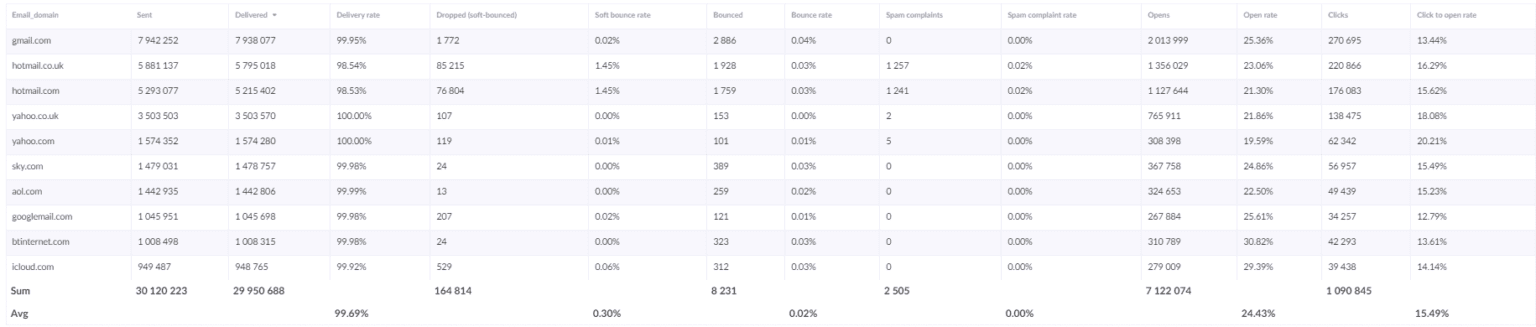
Email Domain Report
The first one is the email domain report, which shows you email marketing metrics for specific recipient domains. This will help you see any deliverability issues with a particular mailbox provider, and you can use the open rate variance metric here. If a certain provider shows 30% lower open rate than the other, this is most likely due to bad inbox placement. Similarly, if there is any spike for soft bounces or hard bounces, you should look into what is causing those issues.
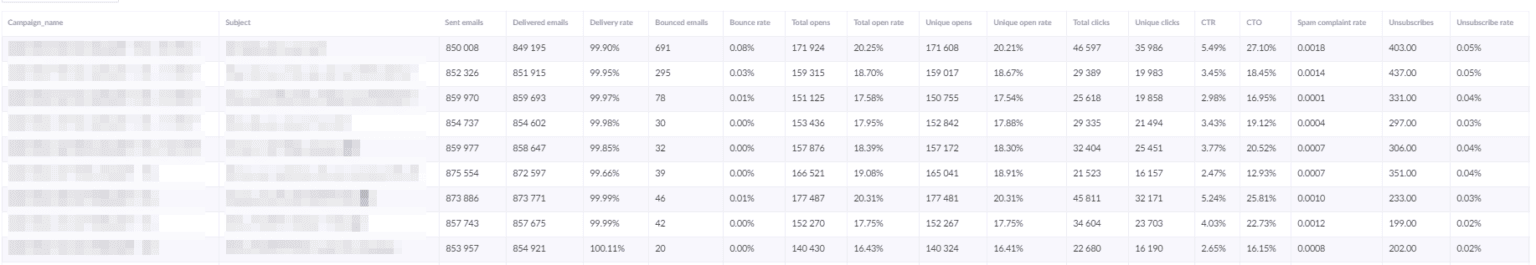
Campaign Report
The second perspective, which uses mostly the same set of important metrics in a different format, is the campaign report. You can get this report by using the previous Email domain report, but in rows, you should use “campaign > campaign name” instead of “email domain”. You can also add “campaign > subject” as an extra row, in case you want to see the subject lines used, or if you tested various subject lines.
This allows you to monitor how your campaigns are doing, e.g. how is different content influencing the click rate, how are different subject lines affecting open rate, etc.
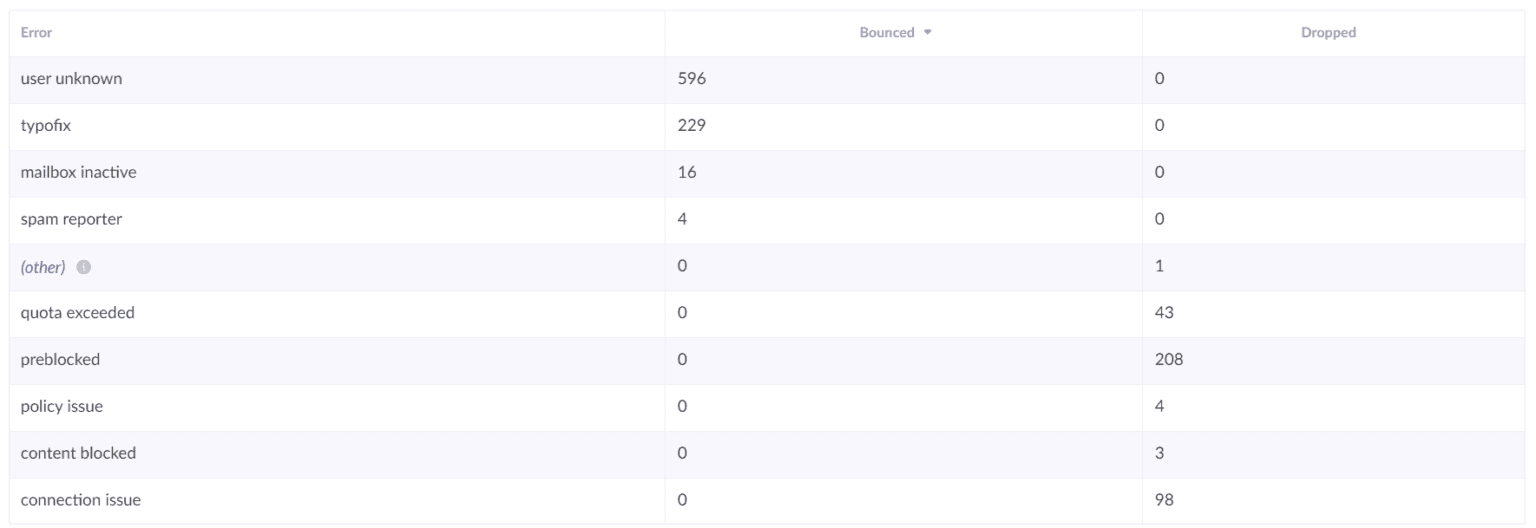
Soft Bounce / Bounce Report
If you spot any problems in the campaign or email domain report, you can use the following report to investigate further. This will help you understand where soft or hard bounces are coming from. Is it bad email list health or is your content being blocked?
Open and Click Time Report
To help you understand when customers are opening or clicking on your emails, and whether this is in-line with their usual shopping time, you can build the following report. You will see most of the opens and clicks happen after sending the campaign, but you might find out that this isn’t when your customers typically do their shopping.
At first sight, we can see a high open-to-purchase ratio before lunch, when the email is sent. But then we can see that customers are opening fewer emails but still shopping.
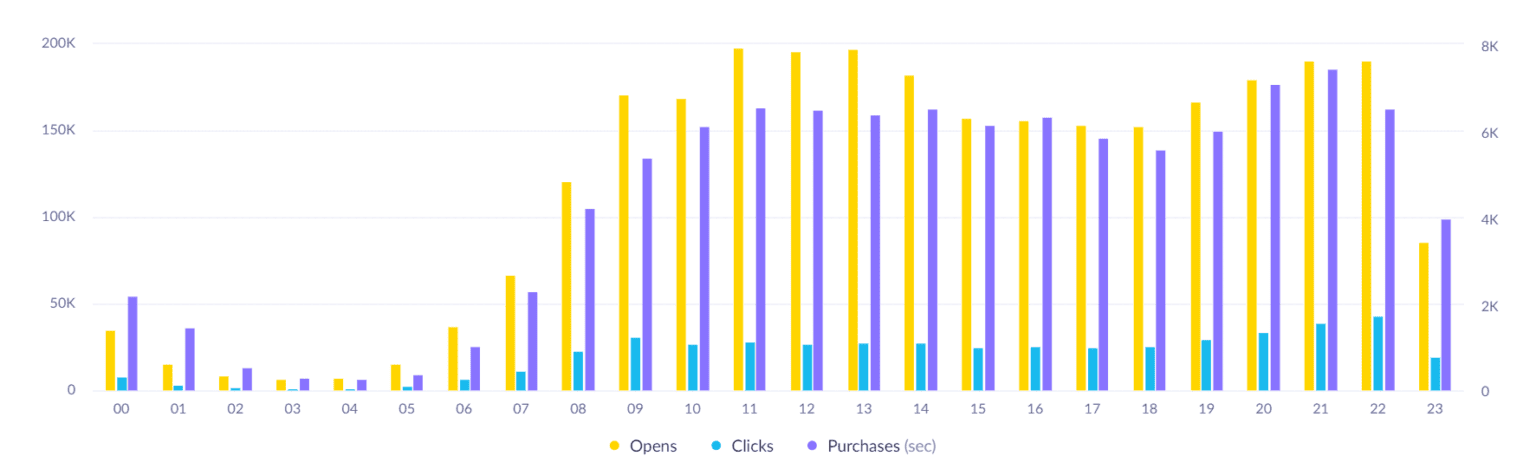
If we hide opens from this view and look at clicks only, we can see that there are spikes in clicks in the morning and late evening, but they don’t correlate with when purchases are happening.
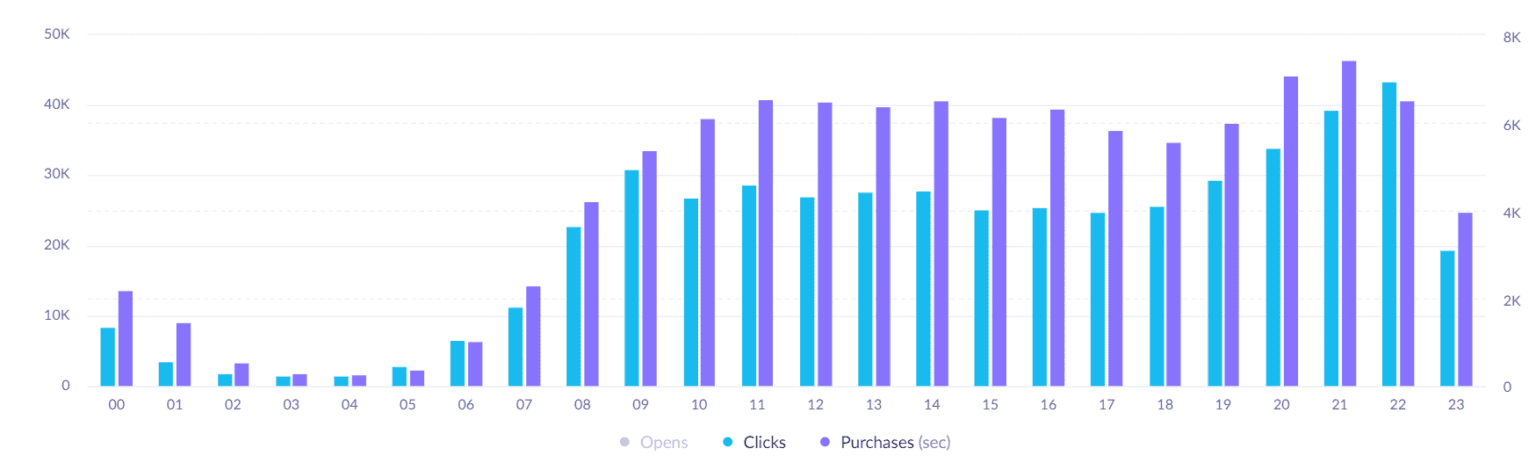
Here you could benefit from using optimal send time prediction, as this would make sure every customer receives an email at their optimal time. If this prediction isn’t available to you, you can also use this for the segmentation of morning and evening shoppers, and send campaigns at two different times for these two segments.
How Bloomreach Improves Your Email Marketing KPIs
Email marketing KPIs are extremely important to measure and there’s a lot to digest. Your efforts depend on good email marketing analytics and aligning your KPIs in the right manner.
With this article as a guide, you can start working on improving your KPIs across the funnel, starting from the top.
You also need technology stack that supports achieving your goals with email marketing analytics. Bloomreach‘s email combines the power of a customer data platform, an email service provider, artificial intelligence, marketing automation, and other web personalization capabilities, so your company can create key marketing campaigns across channels that drive revenue.
Email marketers can unify all of their data to get a single view of each customer and deliver connected shopping experiences with a single solution — delivering personalized product recommendations, personalized email campaigns, and so much more.
Bloomreach turns your email analytics into action, so your company can send fewer emails and drive more revenue. The success our customers achieve is proof — here’s how two brands used email analytics to drive better results with Bloomreach:
Proffsmagasinet Cuts Send Volume and Doubles Email Conversion Rates
Proffsmagasinet, a Swedish B2B retailer, faced a challenge familiar to many email marketers: more volume wasn’t translating into better results.
With Bloomreach, the team rethought their sending strategy entirely, letting data guide how often to contact each subscriber rather than defaulting to high-frequency batch sends. The result was 33% fewer emails, a doubled conversion rate, and more revenue overall.
The results came directly from tracking the right KPIs. Unsubscribe rate dropped 65% once the team stopped over-communicating. Conversion rates doubled as a result of sending more targeted, relevant emails. The team now generates more revenue from a smaller, more engaged send volume.
The takeaway for any email marketer: unsubscribe rate and conversion rate are among your clearest signals that send frequency and content relevance are in balance. Proffsmagasinet used those numbers to make a bold operational change, and the revenue results followed.
Motorpoint Cuts Manual Campaign Work by 40% and Sees 50% Uplift
Motorpoint, one of the UK’s largest independent used car retailers, leveraged Bloomreach to reduce the manual overhead of running their email program. Before the switch, campaign production was consuming a significant chunk of the team’s weekly capacity, leaving little time for strategy or testing.
After moving to Bloomreach, the team saved 40% of their time per week on manual campaign work — redirecting efforts toward building new customer journeys and running more experiments.
The more telling result came from tracking email performance at the campaign level. Product recommendation emails delivered a 50% uplift in email performance compared to the generic follow-up emails Motorpoint had been sending previously. That uplift was measurable because the team was tracking the right KPIs, specifically comparing segmented, behavior-triggered sends against their prior baseline — a measurement that made a clear case for doubling down on personalization.
Ready to see what Bloomreach can do for your email program? Visit our site to learn more and book a demo to see our platform in action.
Frequently Asked Questions
What is a good email open rate in 2026?
A good email open rate varies by industry, but the average across all industries sits in the mid-to-high 30s as of 2026, with reported figures ranging from the low 30s to low 40s depending on the data source. Well-segmented campaigns typically achieve 30-40%, while triggered emails can reach 40-70%. Focus on improving open rates through better subject lines, sender reputation, and audience segmentation rather than chasing industry averages.
How often should I analyze email performance?
Email performance analysis should happen at multiple intervals: daily monitoring for delivery and bounce rates to catch immediate issues, weekly reviews of campaign performance and engagement metrics, and monthly deep-dives into customer lifecycle metrics and overall strategy effectiveness.
What’s the difference between clicks and click-through rate?
Clicks represent the raw number of link clicks in your email, while click-through rate (CTR) is the percentage of delivered emails that received clicks. CTR provides better insight into campaign effectiveness since it accounts for your audience size and delivery success.
How do I calculate email ROI?
Calculate email marketing ROI by dividing revenue attributed to email campaigns by the total cost of your email marketing program (including platform costs, design, content creation, and staff time), then multiply by 100. Use proper attribution windows (typically 5 days for email, 24 hours for SMS) to ensure accurate revenue tracking. According to current industry benchmarks, email typically returns $36-42 per $1 spent, making attribution accuracy critical to understanding your true return.