Early in the month of July, 2020 much of North America and Europe was beginning to re-open from quarantines and strict ‘shelter-in-place’ and ‘lock-down’.
And while Canada, much of Europe, and to some degree the U.K. were able to progress their re-openings, that was not the case in the United States – where the virus infection rate has spiked across much of the country’s southern tier.
That has had a number of primary and secondary effects on customer behaviour and willingness to spend. And these economic conditions and prevailing uncertainty had significant impacts in July, reflected in the B2B numbers as well.
Let’s get into those July numbers:
- North America saw overall traffic rise from June 2020, up 33.47% YoY (July 2020 vs. July 2019). However, total sales were down -4.92% MoM, while remaining a strong +25.17% YoY versus July 2019 and +34.74% YTD compared to 2019 YTD. Digging in we can see a slight MoM in average-order-size (AOS) and Conversion rate. In addition, the increase in on-site search traffic & drop in search sales may indicate lack of inventory in key items.
- UK+EU saw total sales -4.71% MoM, while remaining a moderately strong +11.70% YoY versus July 2019 and a more modest +9.51% YTD compared to 2019 YTD. The effects of reopening can be seen with traffic -10.03% MoM, which may be combined with economic uncertainty, though sales only fell -4.71% MoM. The dramatic drop in AOS YTD reflects the discounting & change in buying habits that have occurred in Europe.
Let’s dig into this past month’s segment numbers:
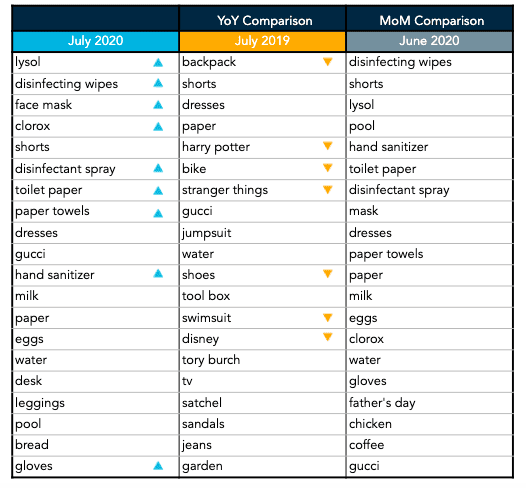
- People are shopping but not buying (to the same degree) in Grocery. Grocery saw the most dramatic drop MoM at -29.44%, but with positive traffic leading to conversion -30.75% MoM. People are leveraging online to search & shop, but not buy in this segment. Search Traffic +128.35% YoY, Sales only +21.80%. Conversion was down a dramatic -29.81% in July from June 2020 meaning there may be a combination of out-of-stock issues and customers leveraging online to search for products that they are purchasing in-store. COVID-19 essentials – disinfectant wipes, hand sanitizer, toilet paper, masks, gloves, lysol, clorox continue to trend high in Grocery.
- General Merchandise held a strong steady line with Sales +5.65% MoM and +12.37% YoY. On-site search grew in use in this category in July. July saw a very strong Conversion rate increase MoM at +33.92% with AOS essentially flat, while down -10.32% YoY. Searches for “Origami” and “arcade” are likely to be aimed at keeping the kids entertained during summer break.
- Done with your project? No, not quite but close. Home-Improvement/DIY saw Sales decline -10.40% MoM, this was still +19.78% and +50.90% YTD. Search was down the equivalent of overall traffic and sales, showing a slowing demand for specific products that drove Home DIY in earlier months of the pandemic. Appearance of air conditioners and fans as top searched items in Home/DIY are clearly due to the impact of summer weather. Further, demand for paint, flooring, doors and shelves in July indicates that people are still working on DIY/upgrade projects for their home interiors as well.
- Home Furnishings was the only segment in positive territory Sales territory MoM +8.75% MoM & an impressive 48.30% YoY. People have very common interests here in home and garden furnishings and related products, as seen by the growth in Search traffic. Appliances saw a dip in searches in July, perhaps demand has been met in this category.
- Apparel has hit a summer calm from acute early pandemic months, only down from June -3.42% & +21.22% YoY. AOS is up YoY & YTD, but Fall season may see greater impacts with lower demand for apparel & possibly an ongoing focus on casual. In Apparel, “masks” ranked higher under Apparel in July 2020, and indication that mask adoption is on the rise. (Wear a mask!)
- Luxury also saw a dip in Overall Sales MoM at -7.75%, despite traffic in the positive. But Sales were still up YoY significantly in Luxury. Search traffic was also up, but overall conversion and search conversion were both down -11.37% & -14.50% respectfully, meaning the demand is there but the products are not. And those searches? Name brands like “Tory Burch”, “Gucci”, “Balenciaga” and “Burberry”. Hey, we will get to go out someday.
- In B2B traffic held steady compared to June, and a strong +38.05% YoY but Sales were -5.60% MoM and -7.36% YoY. Biggest factor in the drop in B2B is the smaller basket sizes with AOS -17.29% MoM and -34.56% YoY. The top searches show why this is the case as “disinfecting wipes” and other PPE dominated the top searches. Overall business uncertainty is having an impact in B2B, even with the growth in the online channel.
The Bloomreach Commerce Pulse report is an aggregation across all Bloomreach customers which comprises 500+ global brands & enterprise businesses selling online and across digital channels. This represents over $200B in annual sales – equivalent of 25% of retail eCommerce in the US and UK – second only to Amazon.com .
You can find all of Bloomreach’s Coronavirus related research, including previous weeks, on our Coronavirus Content Hub. If you have any further questions, I encourage you to reach out here, and we will follow up with you ASAP. We aim to bring you further insights each week as we navigate these challenges together – whether you are a customer or not.
Thank you and be well. Here is to good business.

