A reorder point definition is simple: a reorder point (ROP) is the ideal time to order more stock. The reorder point formula is an equation that ecommerce retailers use to find this ideal time to order.
Inventory management techniques are about making sure you have the right amount of product on hand at all times — no overstocking and no understocking. The bigger your company grows, the tricker this will get, because the reorder point is different for every product variant. For instance, fashion retailers need to solve the ROP formula separately for every color and every size of every item.
But don’t worry: this article will walk you through everything you need to find the ideal reorder points for your products, along with advice for how to scale the process.
What is the Reorder Point Formula?
Whatever the size of your business, proper inventory management can be expensive to ignore. The more inventory you keep on hand, the more it costs to store it. It also means more cash tied up in the cost of the inventory itself, making your finances less liquid. Finally, some inventory will depreciate in value over time, be it perishable foods or trendy clothing.
That’s why the reorder point formula is put to use.
The reorder point formula is determined through three metrics:
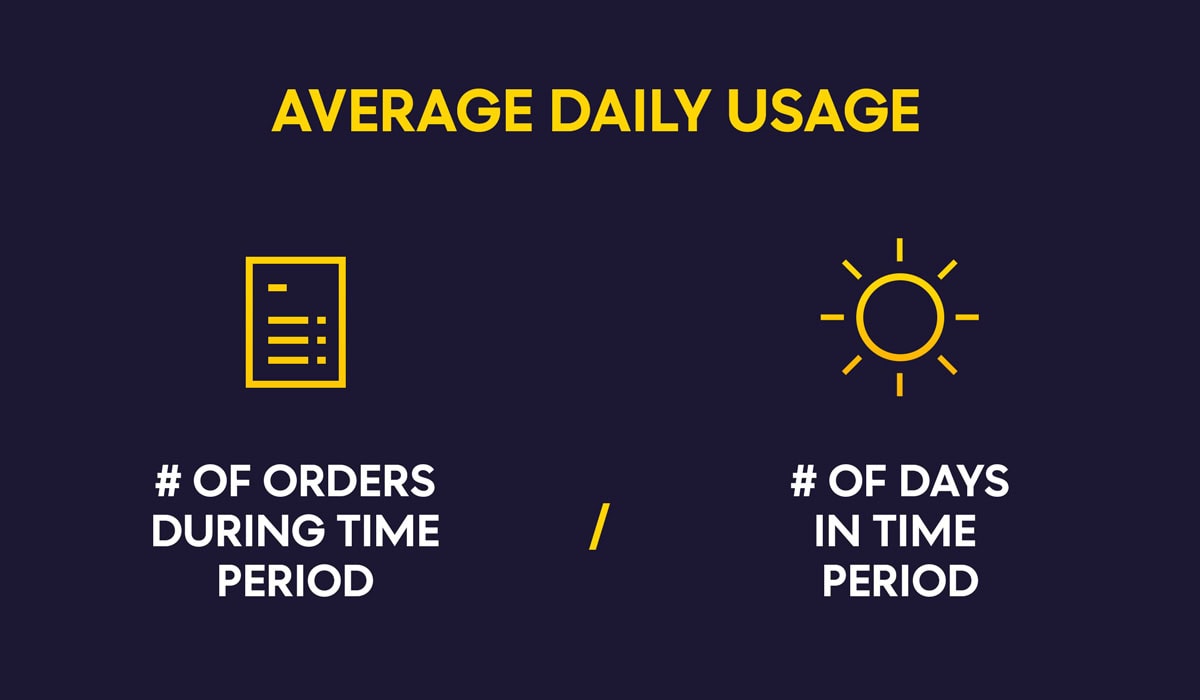
- Average Daily Usage: How much of this product is sold in an average day
- Lead Time (or Average Lead Time): The amount of time between your order and receiving the goods
- Safety Stock: An extra reserve of stock in case you unexpectedly run out
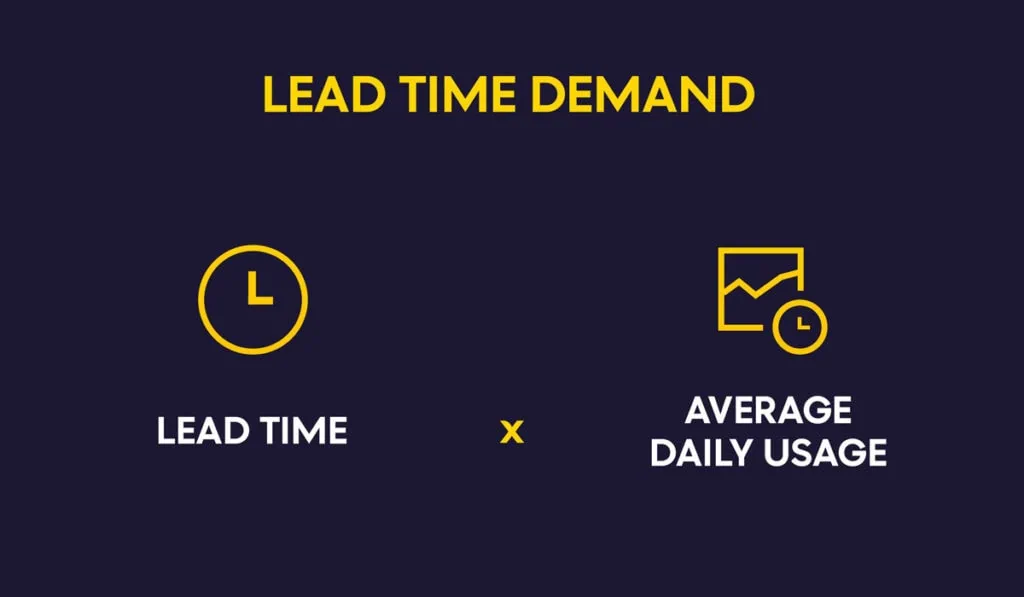
Once you’ve found how many pieces of this product you sell in a usual day (average daily usage), multiply it by your lead time to find your lead time demand.
If you don’t keep safety stock, just remove it from the equation. If you don’t use safety stock and your sales vary greatly day-to-day, replace average daily usage with daily maximum usage (more on finding maximum daily usage later).
Why is the Reorder Point Formula Important?
Keeping a product in stock is a delicate balancing act. Order too much, and you’ll lose profit due to additional carrying costs (storage fees, product depreciation). Order too little, and you’ll lose profit by missing sales due to being out of stock.
The reorder point formula has been mitigating this problem for a long time. Inventory management software exists to speed up and automate the process, but you can still solve reorder point formula on your own.
Solving the reorder point formula manually is a method of inventory management that could lend itself well to businesses large enough to lose track of their inventory, but still small enough that they don’t need a premium software solution. Keep in mind though, it takes a lot longer to do it without the software.
How Do I Solve the Reorder Point Formula?
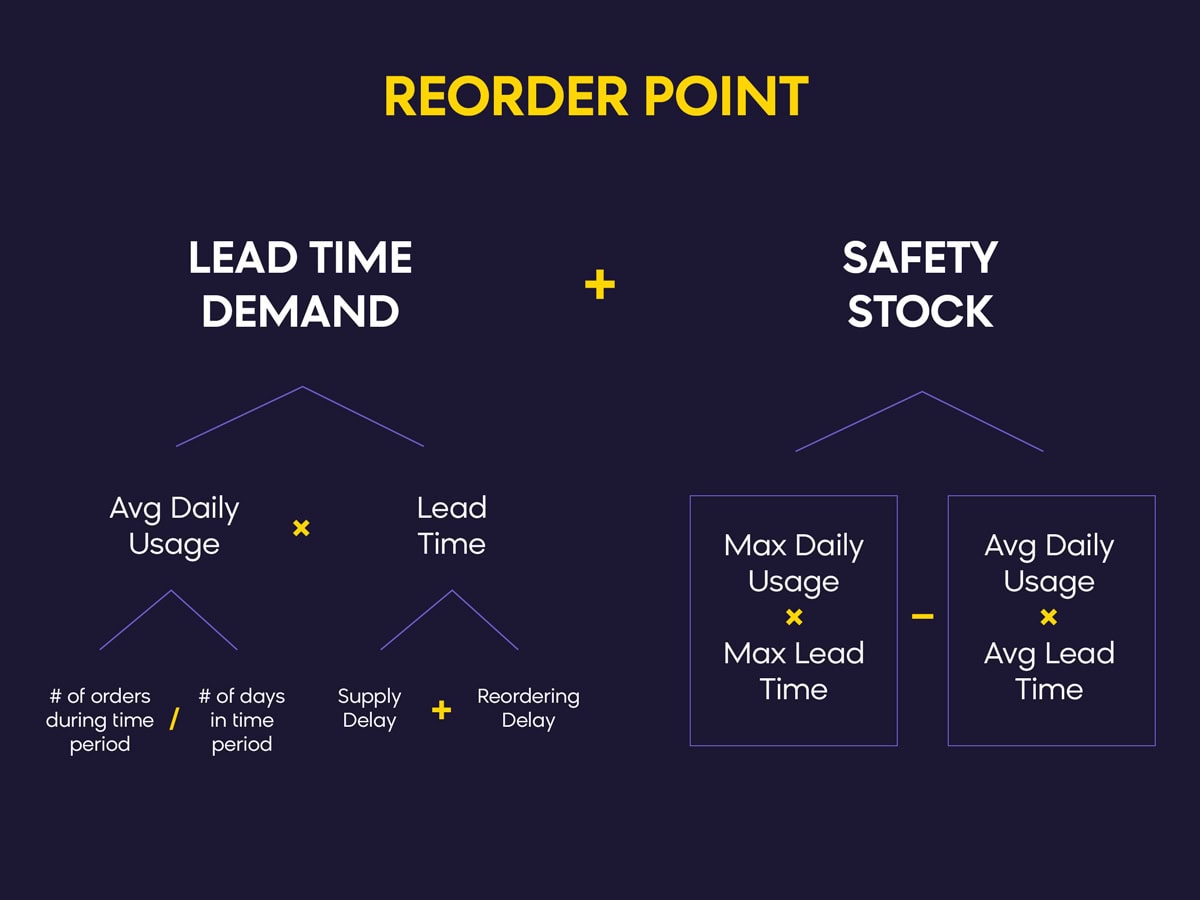
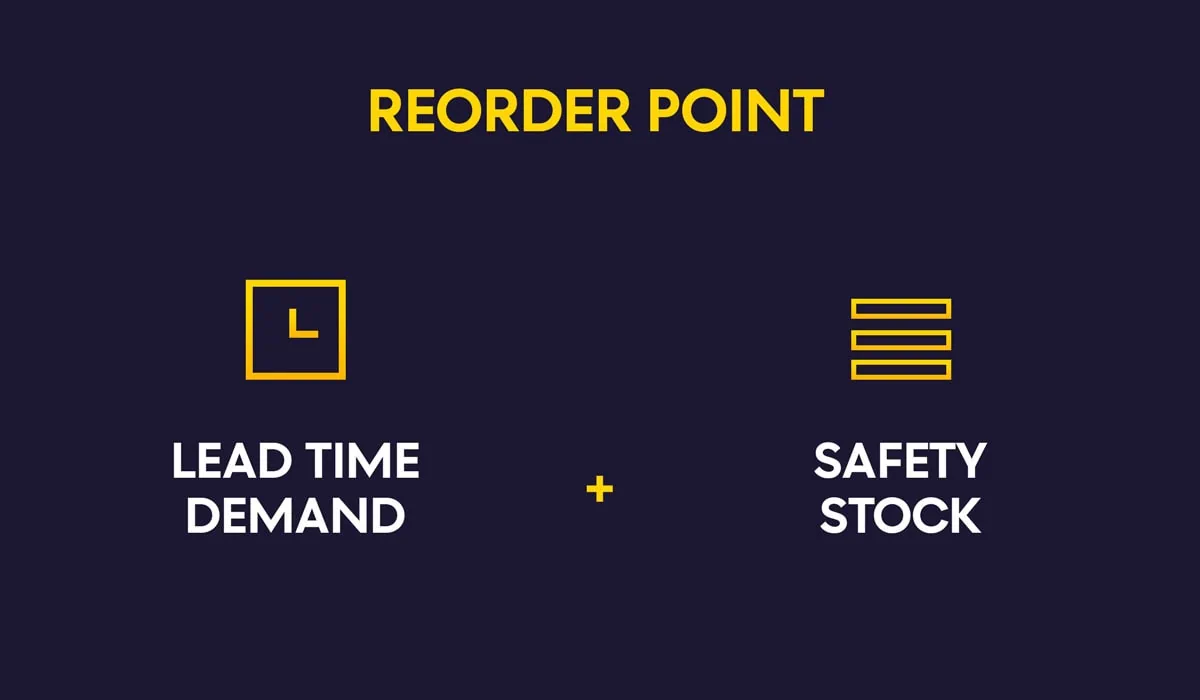
You don’t need a reorder point calculator to solve the ROP formula, it’s simple arithmetic: lead time demand + safety stock.
The harder part is putting together all of the metrics that contribute to lead time demand and safety stock. Everything you need to solve for those metrics is explained below.
How to Find Average Daily Usage
Average Daily Usage
This first calculation tells you how many sales of the given product you make in an average day. To start with, pick a time period to measure. If your business is affected by seasonality (e.g. fashion retail) you might want to find this average for each season, then run the full formula for each season.
To get really accurate, you can use the formula to find the average number of sales for each month, and then find the average for the year based off those results
Average Daily Usage Example
For the sake of simplicity, this article will use one month as the example time period.
Exempli Inc. is a fashion retailer. They need the average daily usage of the medium, blue, variant of one of their popular sweaters from this past month.
Number of sweaters sold: 85
Number of days in the month: 30
85 / 30 = 2.83
Exempli Inc. sells an average of 2.83 of these sweaters each day.
How to Find Lead Time
Lead Time
Next you need to find how long it takes for your products to arrive after you order them. This part is simple. Find your supply delay by adding up how long it takes for your order to be fulfilled. Be sure to include any delays that happen due to approvals needed, order forms processed, etc.
Next, find your reorder delay. This step is often forgotten when retailers find their lead time, and that can lead to mistakes. If your supplier only accepts orders on certain days of the week, you have to include that in your calculations.
Lead Time Formula Example
Let’s take a look at how to calculate lead time:
Exempli Inc. orders their sweaters from a local supplier. It takes one day for the order to be approved, one week from the order date for it to arrive at Exempli’s warehouse, and one day to receive, process, and shelve the new order upon delivery.:
1 + 7 + 1 = 9
Supply Delay = 9 days
Unfortunately, Exempli’s supplier only accepts orders on Wednesdays.
Reordering Delay = ≤ 6
Because there is only one day a week when an order can be placed, and we cannot be sure that our stock will always sell at the same rate, we need to be prepared.
If we see on Thursday that we will need more stock, our warehouse better be storing enough to last, not only the supply delay, but the reorder delay as well. Therefore, our reorder delay is 6 days.
Lead time = 9 + 6
Exempli Inc. must account for 15 days of lead time.
How to Find Lead Time Demand
Lead Time Demand
Lead time demand is the amount you need to have on hand after ordering to be sure you don’t run out before the order arrives. Once you’ve found your average daily usage and your lead time, finding your lead time demand is simple: you just have to multiply the two together.
Lead Time Demand Formula Example
Exempli’s Metrics:
- Average Daily Usage: 2.83
- Lead Time: 15 days
2.83 * 15 = 42.45
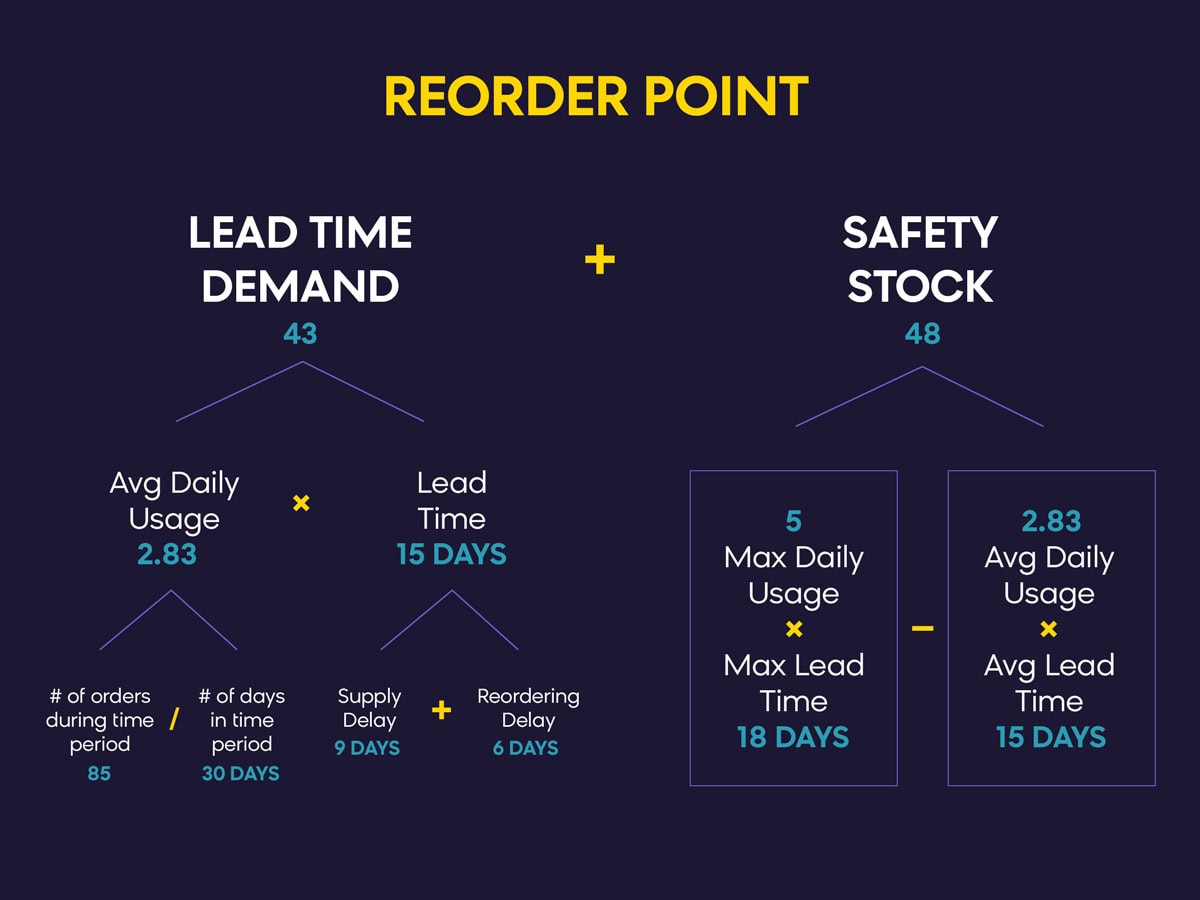
Rounding up, Exempli’s lead time demand is 43. Which means that once their stock of medium, blue sweaters of this type reaches 43, it’s time to order at the next opportunity. Except, we still need to add the safety stock.
How to Find Safety Stock Levels
Safety Stock
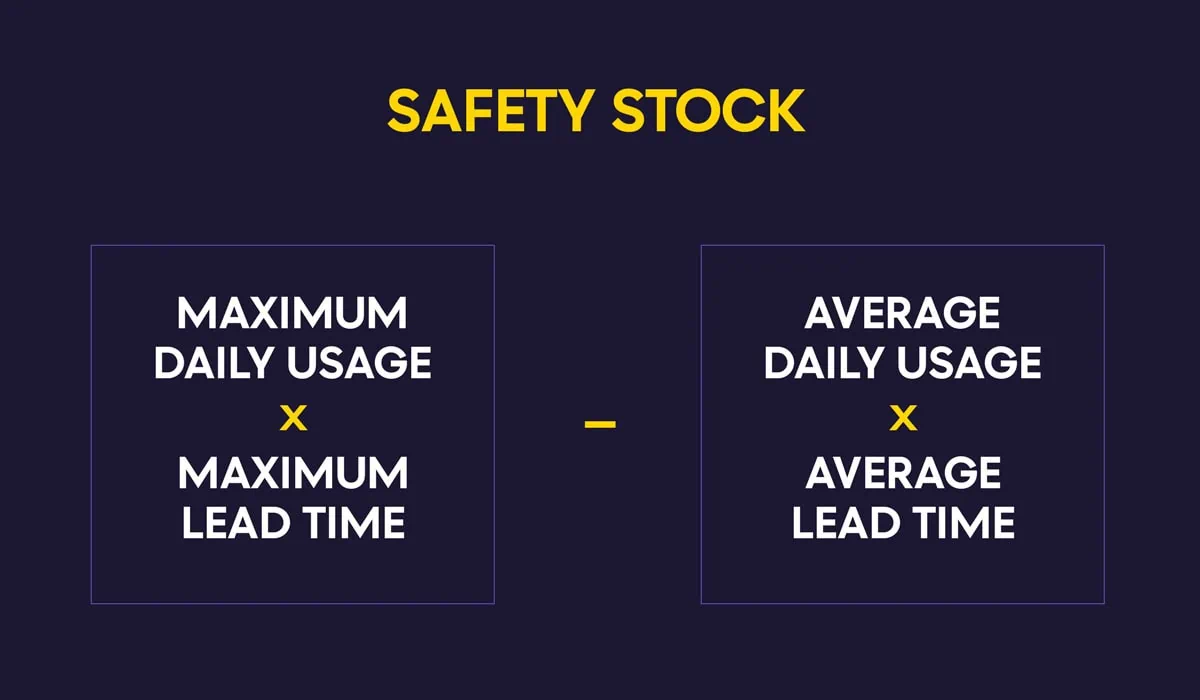
The reason for calculating safety stock and adding it to the equation is to protect yourself. Even if you plan your reorders out perfectly, problems can occur. Using the safety stock equation ensures that even unforeseen circumstances won’t lead to understocking.
You already have two of the safety stock metrics you need (average daily usage and average lead time). Now you just have to find the maximums to perform your safety stock calculation.
MAXIMUM DAILY USAGE
Look through your purchasing history and find how high your daily usage could go.
Exempli may sell 2.83 of these medium, blue sweaters on an average day, but some days they sell as many as 5.
Exempli’s maximum daily usage is 5.
MAXIMUM LEAD TIME
How long will it take to receive your goods when everything goes wrong? In an ideal world, your product would always arrive on time, and your orders would always be placed with no delay. But this is the real world.
Here’s an order where everything went wrong for Exempli:
Due to unexpected seasonal demand, Exempli’s supplier was also running low on product, adding an additional 2 days to get stock in from their manufacturer. Plus, the trucks making the delivery were slowed down by bad weather, causing an additional day of delay.
So the 9 usual days of supplier delay + the 6 days of ordering delay + the 2 days from the supplier + 1 day of road delays.
9 + 6 + 2 + 1 = 18
Exempli’s maximum lead time is 18 days.
Safety Stock Formula Example
As with ROP, the safety stock equation is easy to do without using a safety stock calculator. Let’s take a look at how to calculate safety stock:
5 (max daily usage) * 18 (max lead time) – 2.83 (avg daily usage) * 15 (avg lead time)
(5 * 18) – (2.83 * 15)
90 – 42.45
Safety Stock = 47.5
Solving the Reorder Point Formula
Let’s take a look at how to calculate reorder point:
Once you have your numbers figured out, all you need to do is plug them into the formula.
We’ve plugged in the numbers we found for our reorder point example company, Exempli Inc, below:
Based on these numbers, our lead time demand calculation (rounded up) gives us 43:
2.83 * (9 + 6) = 43
Our safety stock calculation (rounded up) gives us 48:
(5 * 18) – (2.83 * 15)
Which leaves us with one final equation:
43 + 48 = 91
Based on our reorder point calculations, Exempli’s reorder point for the medium, blue, variant of these sweaters is 91. As soon as their inventory drops to 91, it’s time to place the next possible order.
Beyond the Reorder Point Formula
You can run the reorder point formula manually, but it’s a lot faster to use automated software. Remember that each step of the equation we just went through is something that needs to be run for every single product variant you sell.
More than that, you should be running the reorder point formula for each product often to ensure that your figures remain accurate. This is particularly true for businesses that are affected by seasonality, like online fashion retail. A sweater that sells well in December will see a steep drop in popularity come Spring.
This is one of the reasons that automated inventory management software has become so popular. Rather than you having to do the math over and over for each variant of each item you sell, automated software can essentially do it for you, keeping all of your reorder points up-to-date by analyzing trends in the data coming in.
Some retailers are wary of the additional cost of working with a marketing automation company. However, considering the man hours saved with automation, and the budget saved from the greater accuracy provided by the software, these retailers may actually be losing money by not pursuing an automated solution.
If you’re interested in learning more about the reorder point formula, and how it can be used as part of an automated system of inventory management, please reach out to us at Bloomreach for a personalized demo, and a discussion of how automated inventory management could be used for your company.


